


This Enormous 100-Year-Old Map of Rome is Still the City's Best
The document is almost as tall as a two-story building. Here's how a 19th century archaeologist made the best map of the most mapped city in history.
A 1901 map of Rome is arguably the best map ever made of the most mapped city in human history. The map, created by archaeologist Rodolfo Lanciani, documents the city in meticulous detail from its ancient past through the end of the 19th century.
The map is huge. Fully assembled, it’s roughly 17 feet by 24 feet. Lanciani published it as 46 separate sheets over the course of eight years.
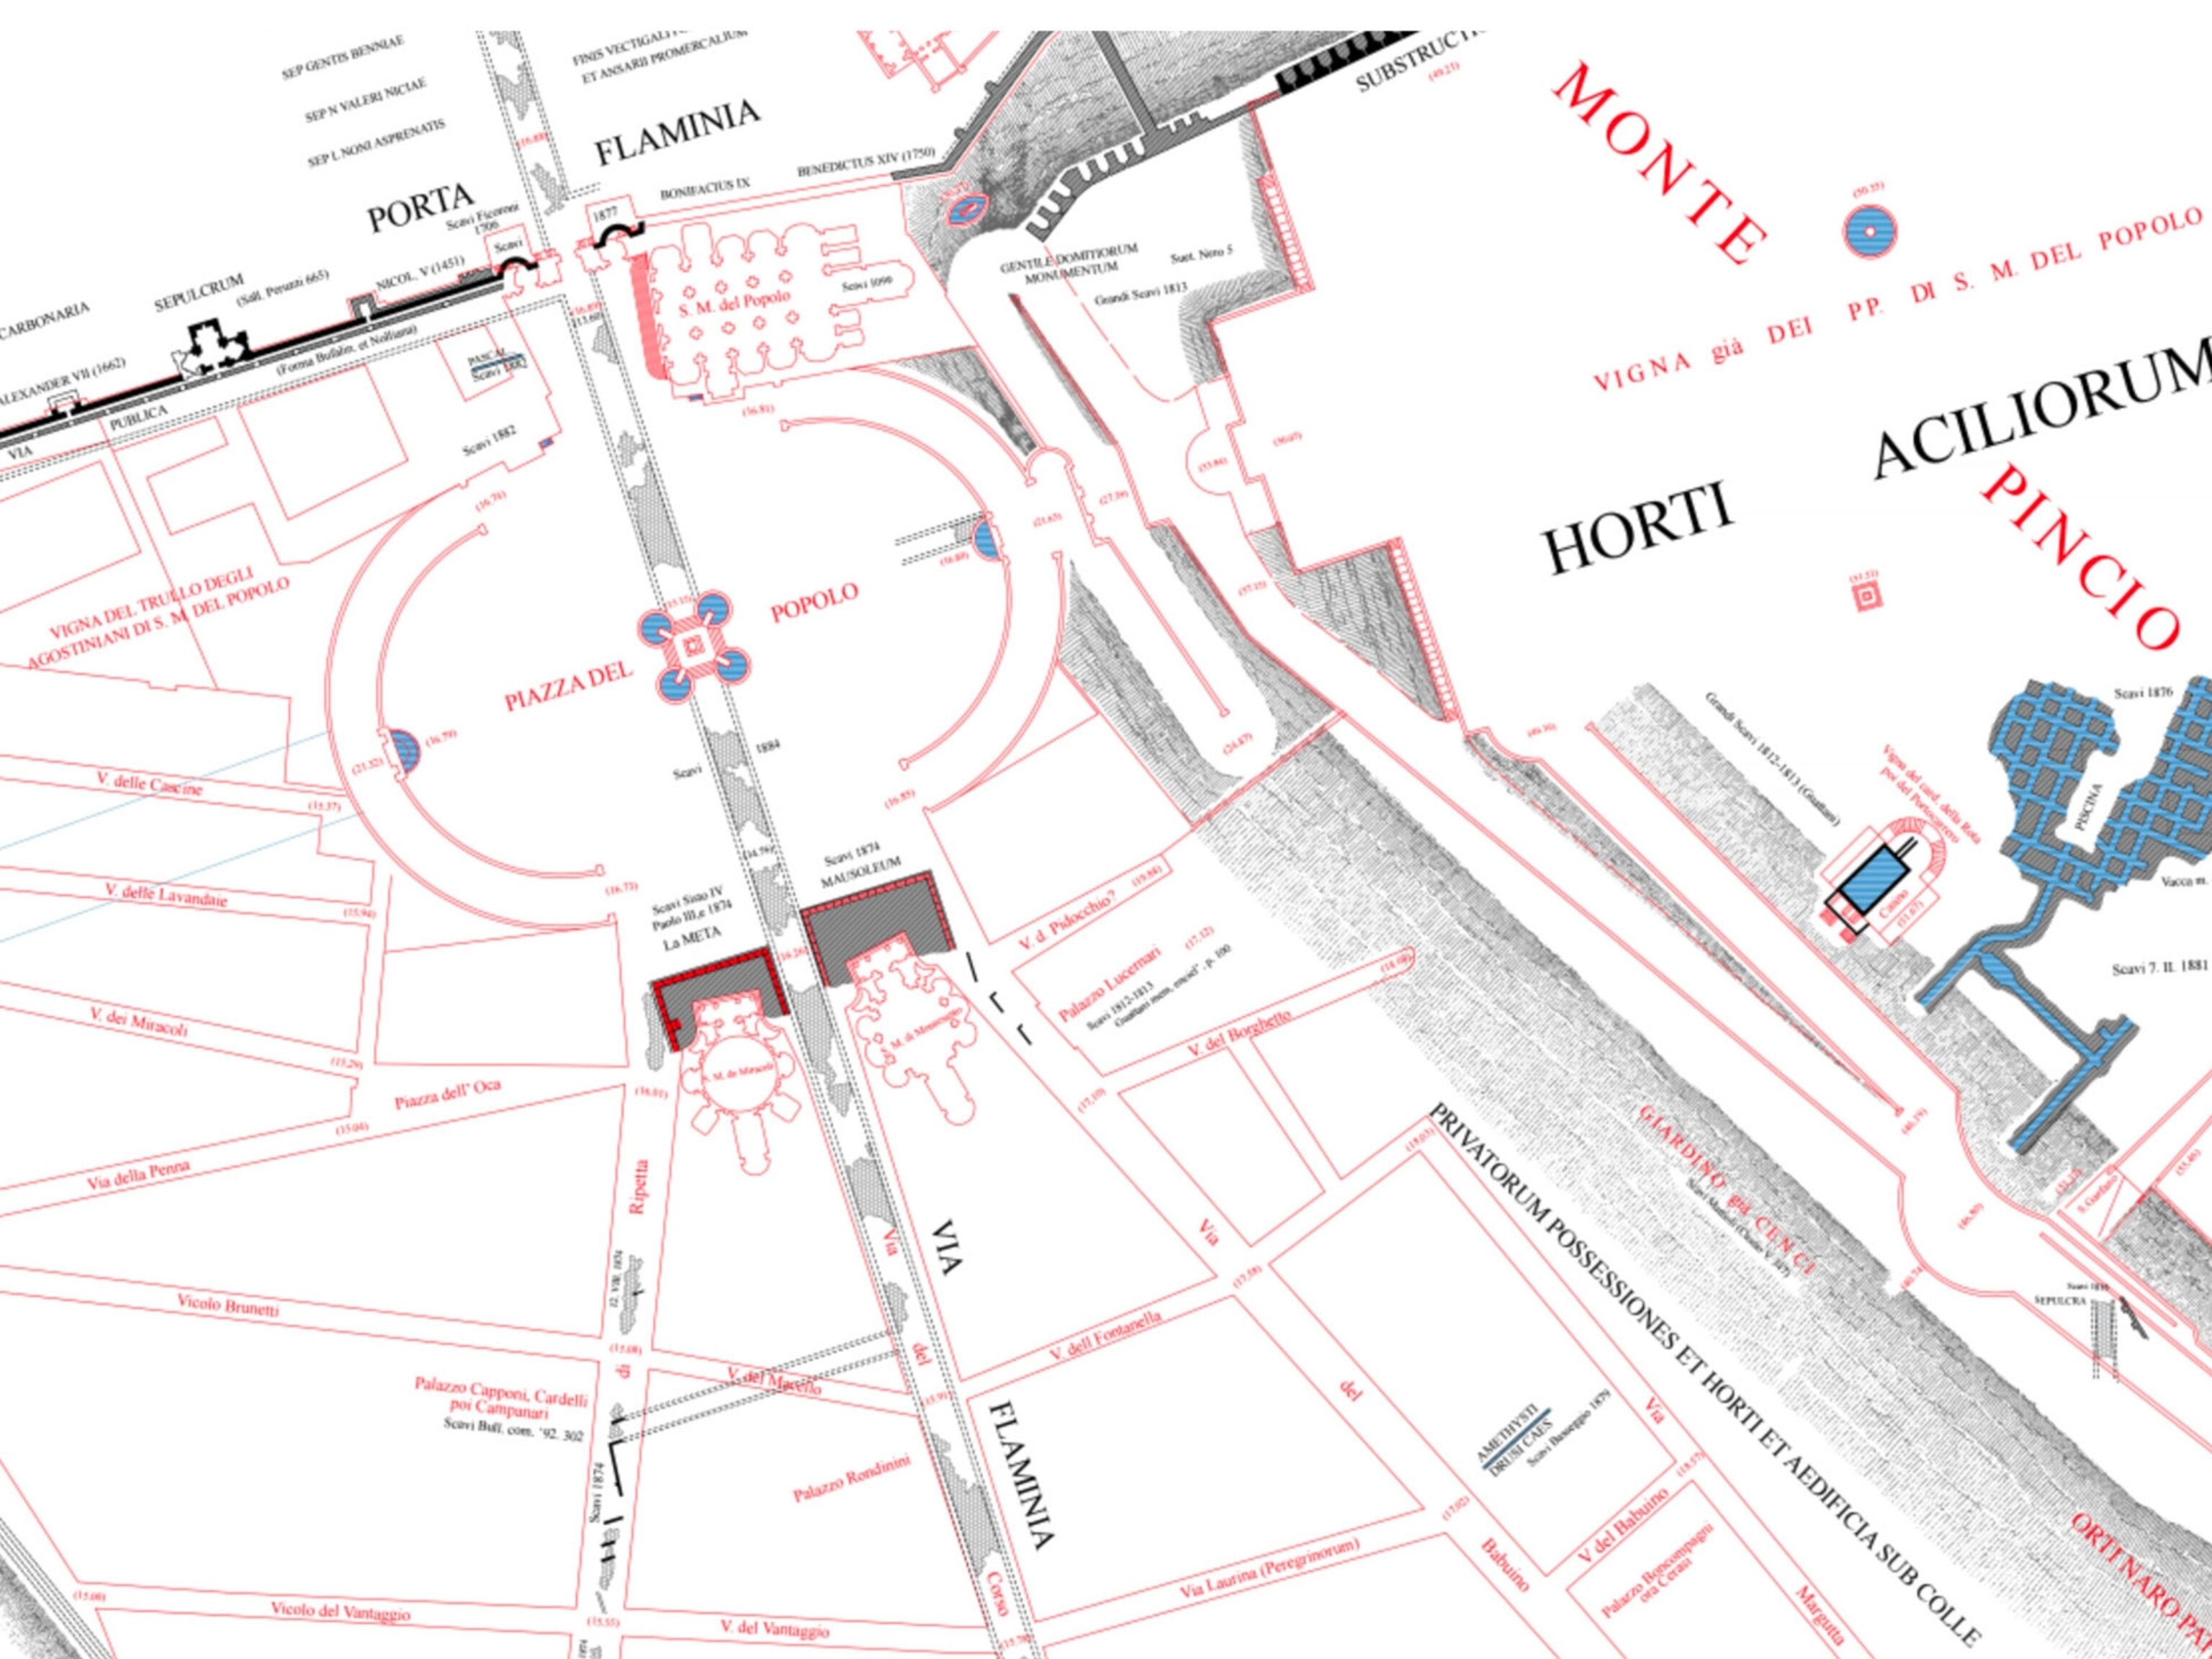
Lanciani’s map is color coded, so that the ancient and medieval parts of the city are depicted in black, early modern parts are red, and modern parts are blue (from Lanciani’s perspective, modern meant anything after about 1871, when Rome became the capital of a newly unified Italy).
“It’s one of the first attempts to show the different periods of historic Rome on a map,” says Allan Ceen, an urban historian and collaborator on the MappingRome project, which seeks to draw on and digitize a variety of historical sources to map centuries of changes to Rome.
To make his map, Lanciani collected thousands of photographs, sketches, and other documents, which until now have been largely inaccessible. Since his death in 1929, his archive has been held at Italy’s Istituto Nazionale di Archeologia e Storia dell’Arte (National Institute of Archaeology and Art History) in Rome, where even researchers have had limited access to it. But now a team of scholars from three U.S. universities, in collaboration with the Italian government, has digitized about 4,000 of these documents and made them freely available online for anyone to view. (The same team previously put most of Lanciani’s map online as part of MappingRome).

Lanciani named his map Forma Urbis Romae, after an early third century map of the same name that was carved in marble. This ancient map would have made even Lanciani’s enormous map look puny—it was roughly 43 by 60 feet. At a remarkable scale of 1:240, even the floor plans of buildings were visible in considerable detail. Only fragments of the marble map have survived (1,186 are currently known and accounted for), and Lanciani referred to these in creating his map.
Another major source he used was the beautiful 1748 map created by Giambattista Nolli (see below). Nolli was an architect and surveyor, and his map of Rome bucked the cartographic tradition of the time, which favored a slightly elevated bird’s eye perspective. Nolli’s map, in contrast, shows the city from a vantage point that looks directly down on it. Buildings are completely flat, with their outlines and basic floor plans visible. The detail is remarkable, and remarkably accurate—centuries later, modern satellite maps line up well with Nolli’s map.

Much had changed in Rome since Nolli’s day, of course, and Lanciani turned to tax maps, architectural plans, sketches, drawings, paintings, and photographs to fill in details about the city’s development. Much of this material is now accessible in the online archive.
The archive reveals how designers throughout history cleverly navigated Rome’s topography and existing architecture. One series of drawings, for example, shows the evolving plans for the Piazza del Popolo, a large public square that was redesigned in the early 1800s by the architect Giuseppe Valadier. One of Valadier’s early designs would have created a polygonal piazza. A later plan drawn, by another architect depicts an oval piazza with a series of symmetrical ramps on the left side leading up a hill that borders the square (see below). In the design that eventually won out, Valadier kept this oval shape and reworked the ramps to make them more graceful and easier to navigate.
“The particular problem that Valadier solved brilliantly was to connect the original piazza with the top of the Pincian hill which overlooks it through a system of ramps, suitable for horse carriages to negotiate,” says James Tice, a professor of architecture at the University of Oregon and one of the leaders of the MappingRome project. Today, Tice adds, those ramps are still used—by people on bicycles.

Lanciani happened to live during a pivotal time in the history of Rome. He was a young man when Italy, long a collection of separate states, was finally unified in 1871, with Rome as its capital. At the time, a major expansion project was under way to fill in unused spaces within the boundaries of the ancient city, and all this construction was turning up ruins that had been buried for centuries, Ceen says.


“Lanciani was able as an archaeologist to see many newly excavated ruins,” Ceen says, “and his archive has a lot of the drawings he made to record these things as they were being discovered in the late 1800s.”
That Lanciani lived during this time was a lucky break for future generations, because as often as not the ruins were covered up by the new construction as quickly as they were unearthed. “Lanciani was dismayed and distraught as parts of the city were being built up on the ruins of ancient Rome and and erasing the history of the city,” Tice says.
One of the long-term goals for the MappingRome project is to update and improve the digital version of Lanciani’s map, Tice says. That work includes aligning it with a modern digital map of Rome so users can easily locate the sites Lanciani depicted on the modern street grid; correcting a handful of mistakes Lanciani made; and updating his map with ruins discovered in the past century. Eventually, Tice says, the team also wants to create more detailed layers—breaking Lanciani’s single black layer for ancient buildings into multiple layers corresponding to historians’ subdivisions of the ancient period.
Lanciani’s map has aged gracefully in the century since it was created, and with a little help it should keep historians and urban designers engaged and inspired well into the future. Its clean, elegant design packs in an astounding amount of detail, making it possible to picture Rome as it once was, as it became, and as it might become.

If you like maps of urban history, check out our previous story on how Boston made itself bigger by filling in the bay around it, or this one on why dozens of Gold Rush era ships are buried under the streets of San Francisco.
Follow All Over the Map on Twitter and Instagram.
Related Topics
You May Also Like


Go Further
Animals
- Fireflies are nature’s light show at this West Virginia state parkFireflies are nature’s light show at this West Virginia state park
- These are the weird reasons octopuses change shape and colorThese are the weird reasons octopuses change shape and color
- Why young scientists want you to care about 'scary' speciesWhy young scientists want you to care about 'scary' species
- What rising temperatures in the Gulf of Maine mean for wildlifeWhat rising temperatures in the Gulf of Maine mean for wildlife
- He’s called ‘omacha,’ a dolphin that transforms into a man. Why?He’s called ‘omacha,’ a dolphin that transforms into a man. Why?
Environment
- What rising temperatures in the Gulf of Maine mean for wildlifeWhat rising temperatures in the Gulf of Maine mean for wildlife
- He’s called ‘omacha,’ a dolphin that transforms into a man. Why?He’s called ‘omacha,’ a dolphin that transforms into a man. Why?
- The northernmost flower living at the top of the worldThe northernmost flower living at the top of the world
- This beautiful floating flower is wreaking havoc on NigeriaThis beautiful floating flower is wreaking havoc on Nigeria
- What the Aral Sea might teach us about life after disasterWhat the Aral Sea might teach us about life after disaster
History & Culture
- Scientists find evidence of ancient waterway beside Egypt’s pyramidsScientists find evidence of ancient waterway beside Egypt’s pyramids
- This thriving society vanished into thin air. What happened?This thriving society vanished into thin air. What happened?
Science
- Why pickleball is so good for your body and your mindWhy pickleball is so good for your body and your mind
- Extreme heat can be deadly – here’s how to know if you’re at riskExtreme heat can be deadly – here’s how to know if you’re at risk
- Why dopamine drives you to do hard things—even without a rewardWhy dopamine drives you to do hard things—even without a reward
- What will astronauts use to drive across the Moon?What will astronauts use to drive across the Moon?
- Oral contraceptives may help lower the risk of sports injuriesOral contraceptives may help lower the risk of sports injuries
- How stressed are you? Answer these 10 questions to find out.
- Science
How stressed are you? Answer these 10 questions to find out.
Travel
- Fireflies are nature’s light show at this West Virginia state parkFireflies are nature’s light show at this West Virginia state park
- How to explore the highlights of Italy's dazzling Lake ComoHow to explore the highlights of Italy's dazzling Lake Como
- Going on a cruise? Here’s how to stay healthy onboardGoing on a cruise? Here’s how to stay healthy onboard
- What to see and do in Werfen, Austria's iconic destinationWhat to see and do in Werfen, Austria's iconic destination
