Tag Archive for: Tutorial

Ozone is a free graphical debugger for embedded firmware from SEGGER. It’s a powerful tool that can give you deep visibility into what’s happening in your embedded system. It’s especially useful when debugging nRF9160 Zephyr apps. Sorting out multiple threads and multi image builds can be tough, but this is the tool you want.

In our previous post Taking the next step: Debugging with SEGGER Ozone and SystemView on Zephyr, Chris Gammell wrote about how to set up a SEGGER Ozone project to debug a Zephyr app running on the i.MX RT1060 Evaluation Kit. It’s a great general introduction to debugging a Zephyr app in Ozone and profiling the RTOS runtime behavior SystemView.

When I was trying to set up a similar Ozone project for debugging the Nordic nRF9160 SIP, I ran into a few snags along the way. Today, I’ll share what I’ve learned!

In this article, I’ll walk through how to:

  • Configure a nRF9160 Zephyr app for thread-aware debugging
  • Create an Ozone project for nRF9160 with the New Project Wizard
  • Modify the Ozone project to support debugging nRF9160 multi-image builds

Hardware Configuration

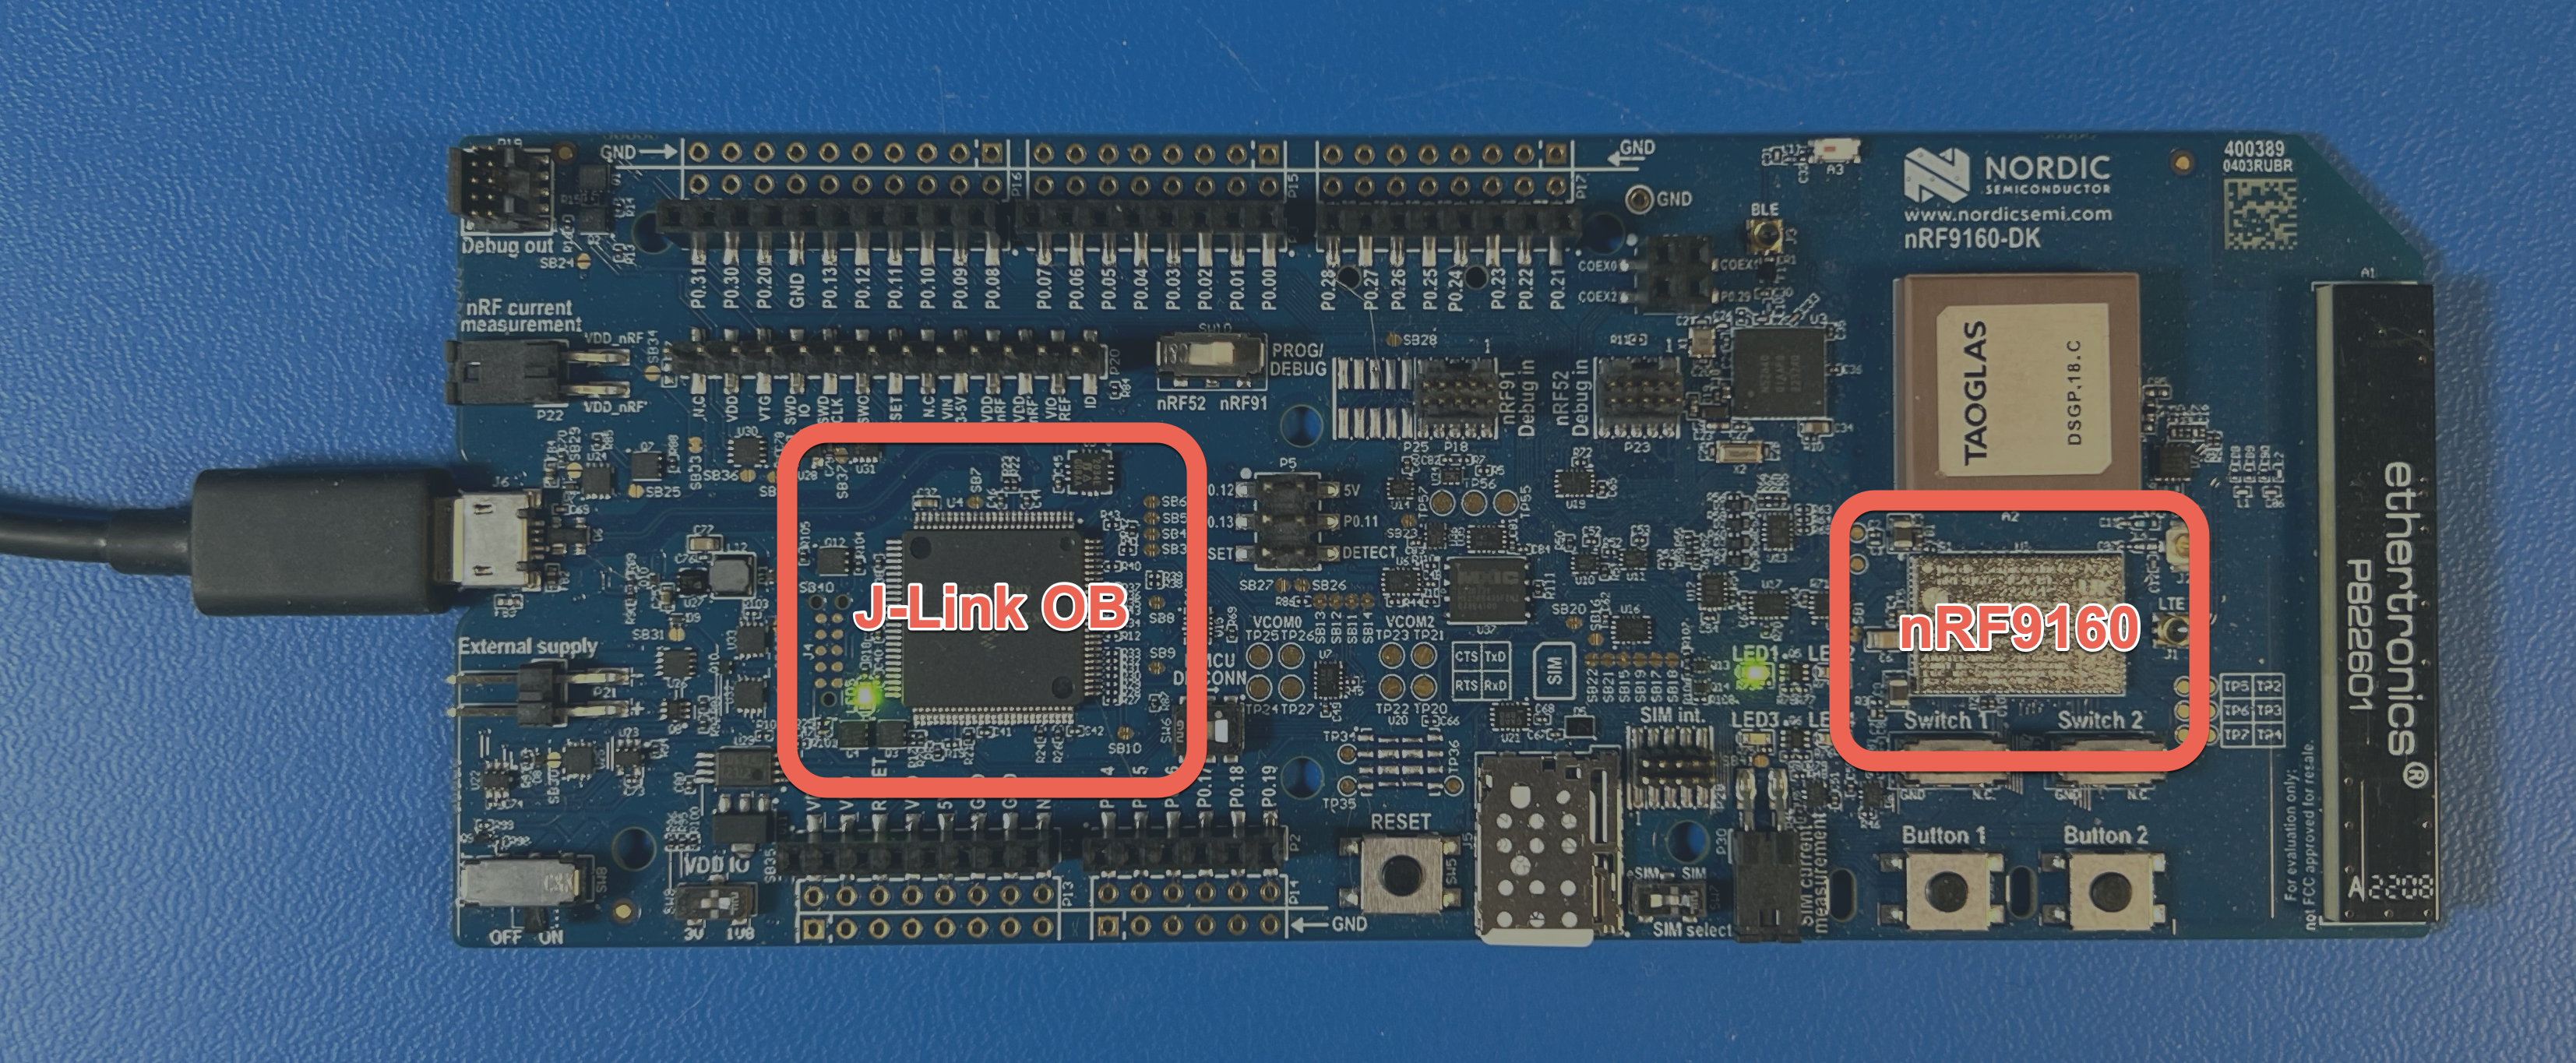
In the examples that follow, I’ll be using the Nordic nRF9160 DK board. This development kit from Nordic has a SEGGER J-Link OB debugger built into the board, so an external J-Link debugger is not required to follow-along with the examples.


Thread-awareness support in Zephyr

In a typical Zephyr app built using the Golioth Zephyr SDK, there will be multiple threads. For instance, one for the app’s main loop, one for the Golioth system client, and others for the UART shell, logging subsystem, network management, etc.

SEGGER provides a Zephyr RTOS plugin for Ozone that can show the status of each thread, but it requires that the Zephyr firmware is built with support for thread-aware debugging. Zephyr provides a CONFIG_DEBUG_THREAD_INFO Kconfig symbol that instructs the kernel to maintain a list of all threads and enables thread names to be visible in Ozone.

While you could simply add CONFIG_DEBUG_THREAD_INFO=y to your app’s prj.conf file, you probably only want to enable this extra debug info when you are building for debugging purposes. Instead, we can create an additional debug.conf Kconfig file that will only get merged in when we pass the -DEXTRA_CONF_FILE=debug.conf argument to the build system.

Since this article is about using Ozone for thread-aware debugging, we’ll use the zephyr/samples/basic/threads/ app from the nRF Connect SDK Zephyr repo as our example app in this article.

If this is your first time building one of the Zephyr sample apps, make sure to complete the nRF Connect SDK Installation Guide first to make sure your dev environment is set up correctly.

How to Enable Thread-Awareness

First, create a zephyr/samples/basic/threads/debug.conf file and add the following lines:

CONFIG_DEBUG_THREAD_INFO=y

# CONFIG_DEBUG_THREAD_INFO needs the heap memory pool to
# be defined for this app
CONFIG_HEAP_MEM_POOL_SIZE=256

Next, build the firmware, specifying the debug.conf file to be merged into the build configuration:

cd <your ncs workspace>/
west build -p -b nrf9160dk_nrf9160_ns zephyr/samples/basic/threads/ -- -DEXTRA_CONF_FILE="debug.conf"

If the build completed successfully, you’ll see the build/zephyr/zephyr.elf file we need to start a debugging session in Ozone.

Create the Ozone project

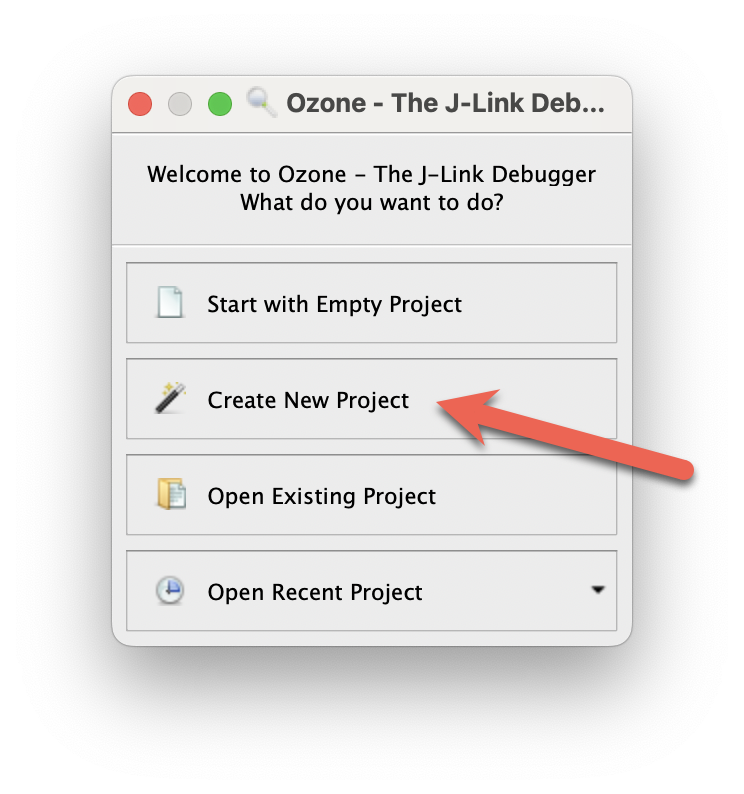
Now that we’ve built the firmware, you can launch Ozone and use the New Project Wizard to create an Ozone project:

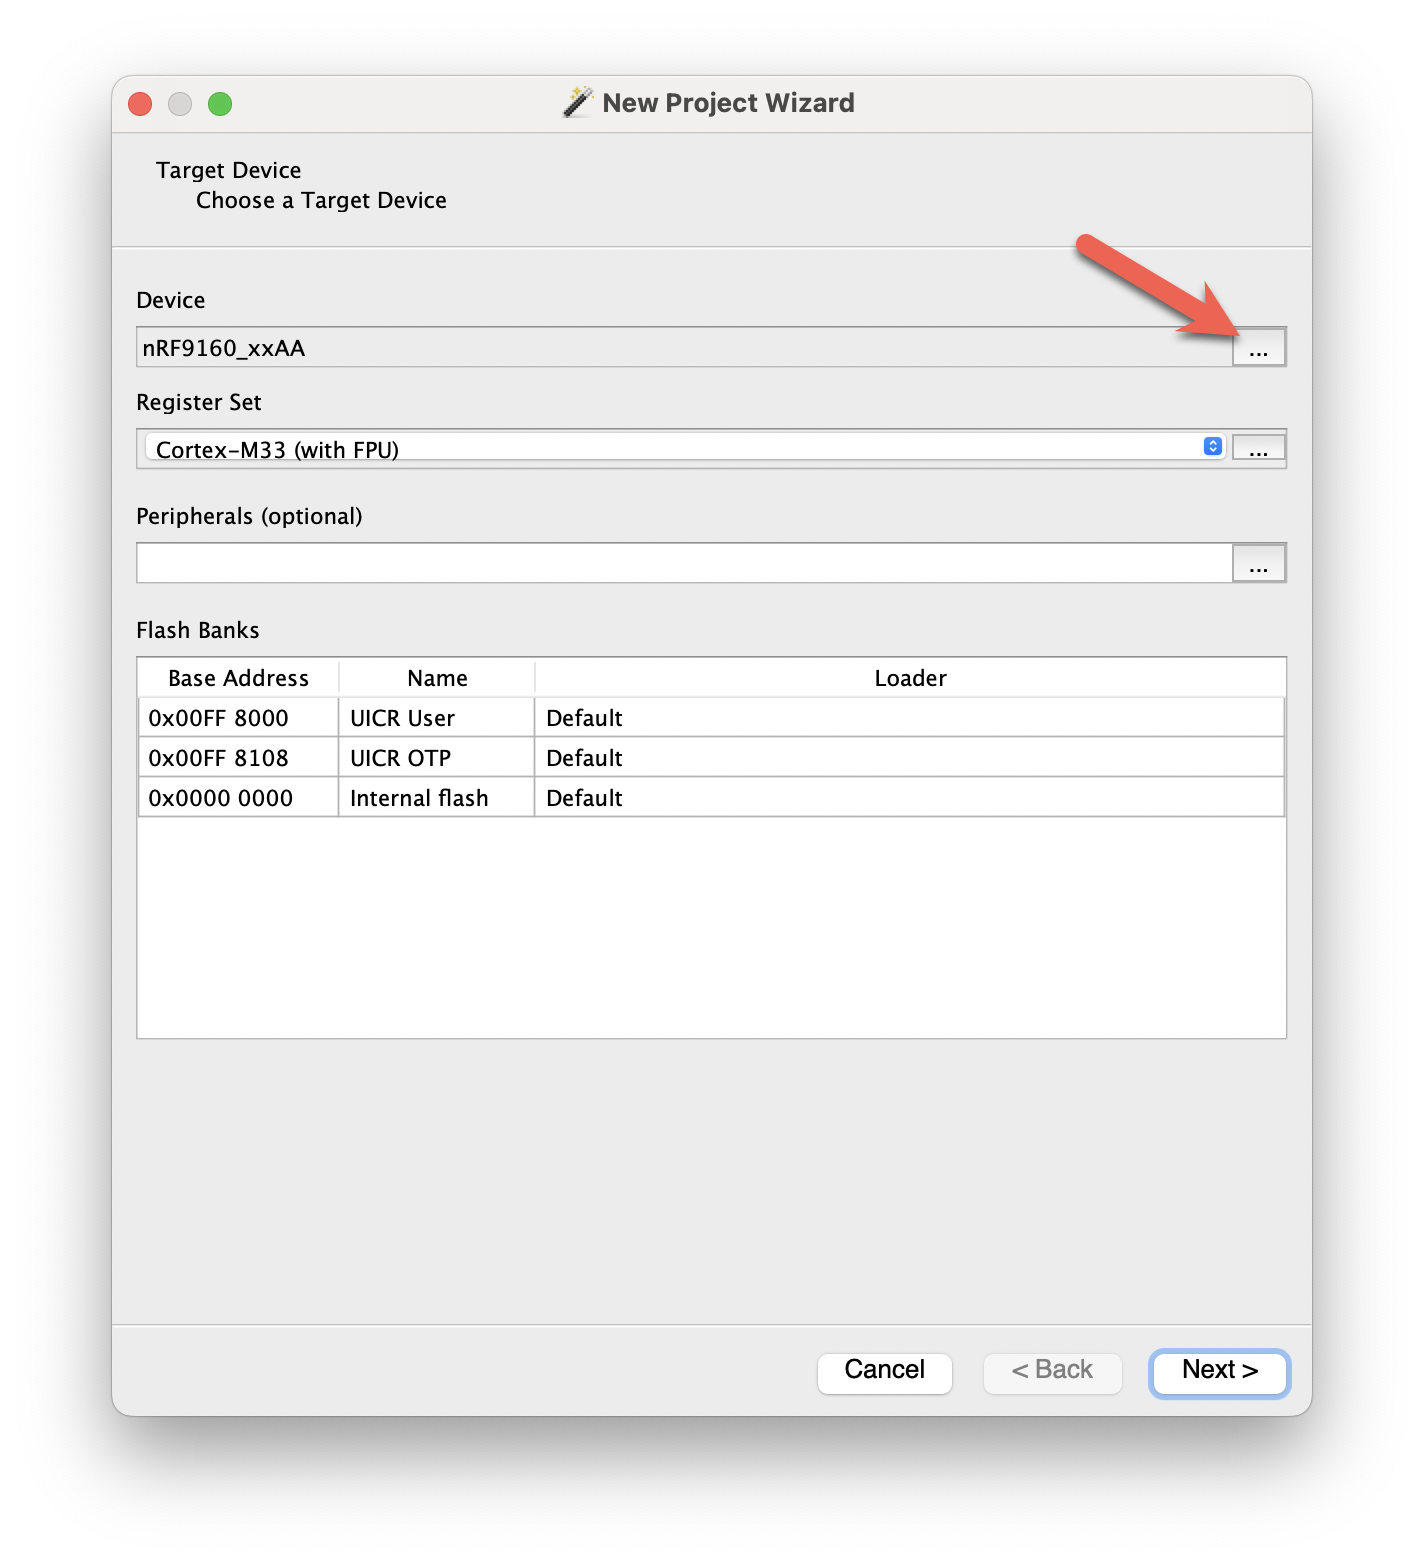
Choose the nRF9160_xxAA device:

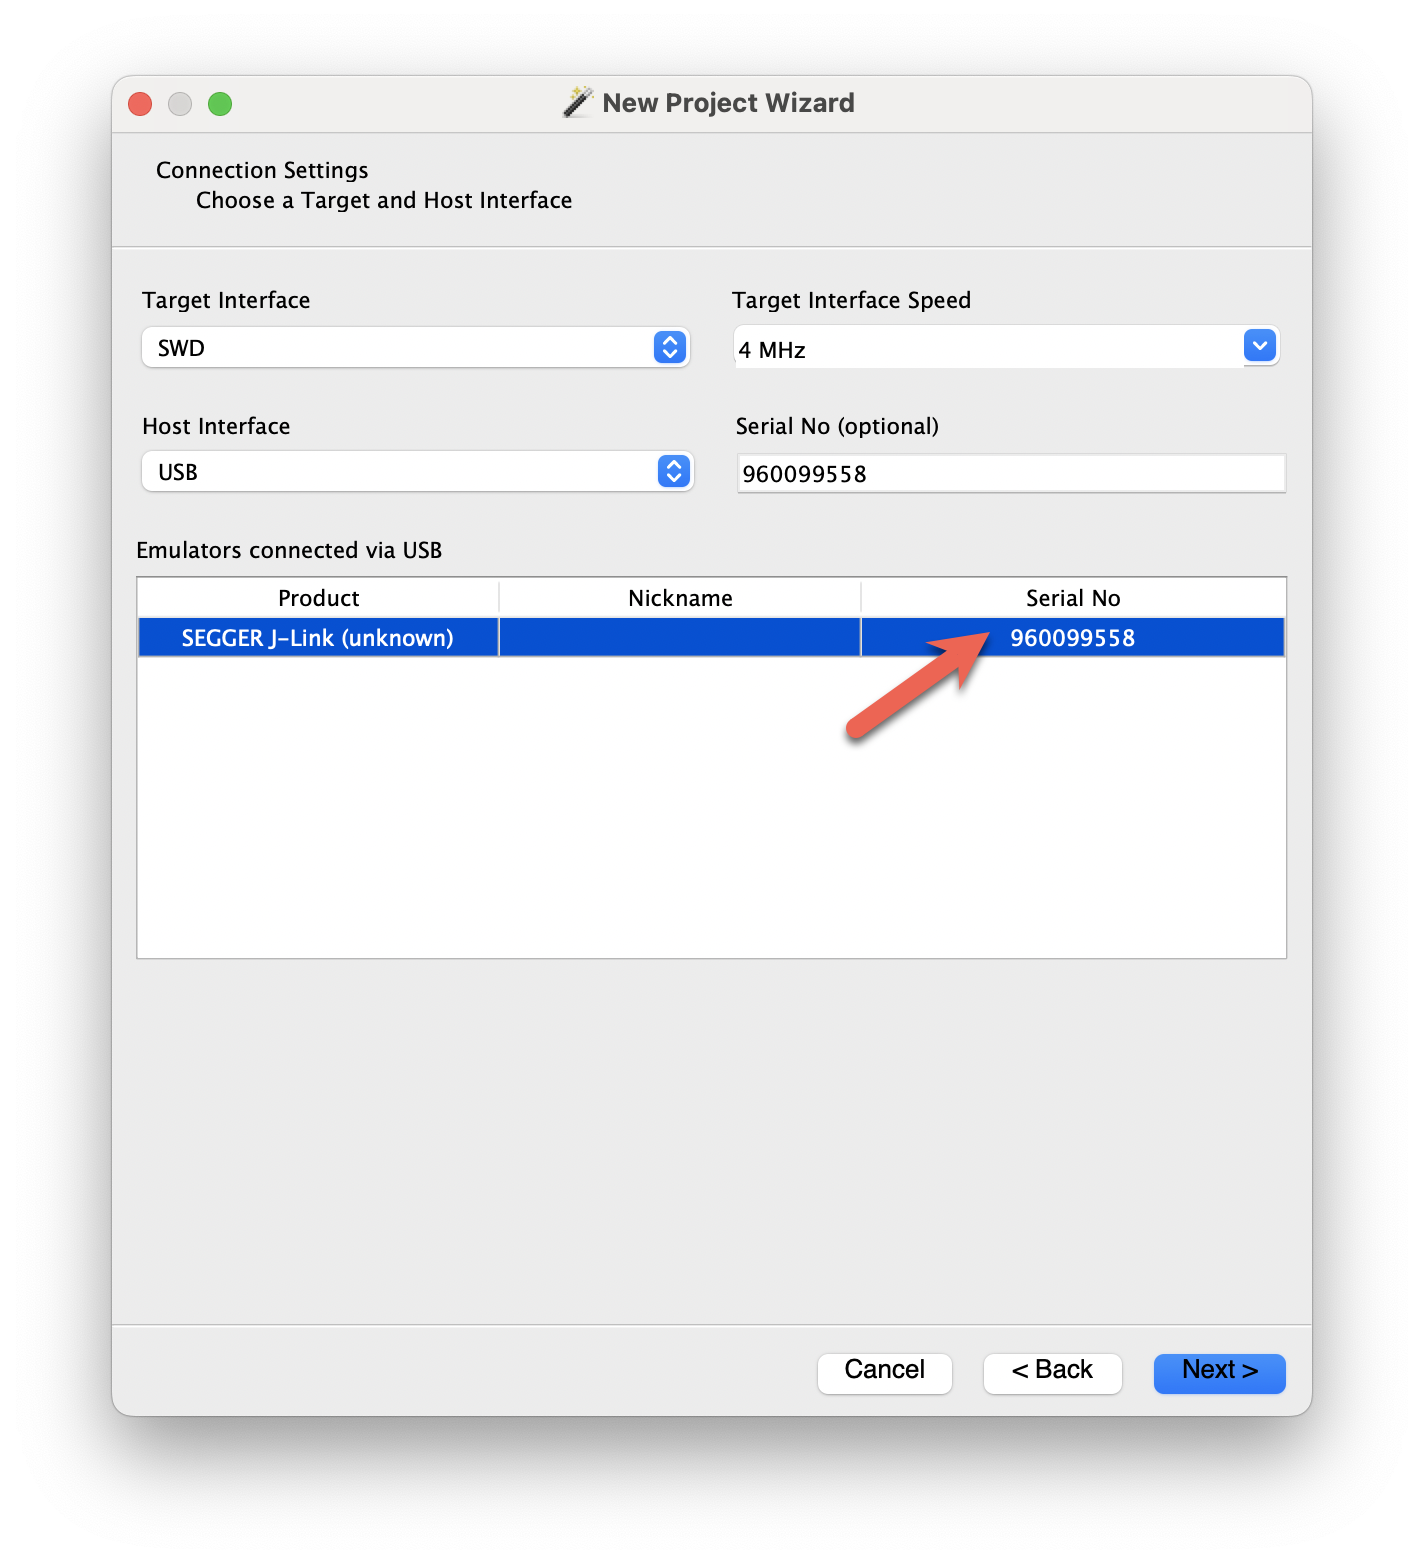
Select the J-Link device you want to use:

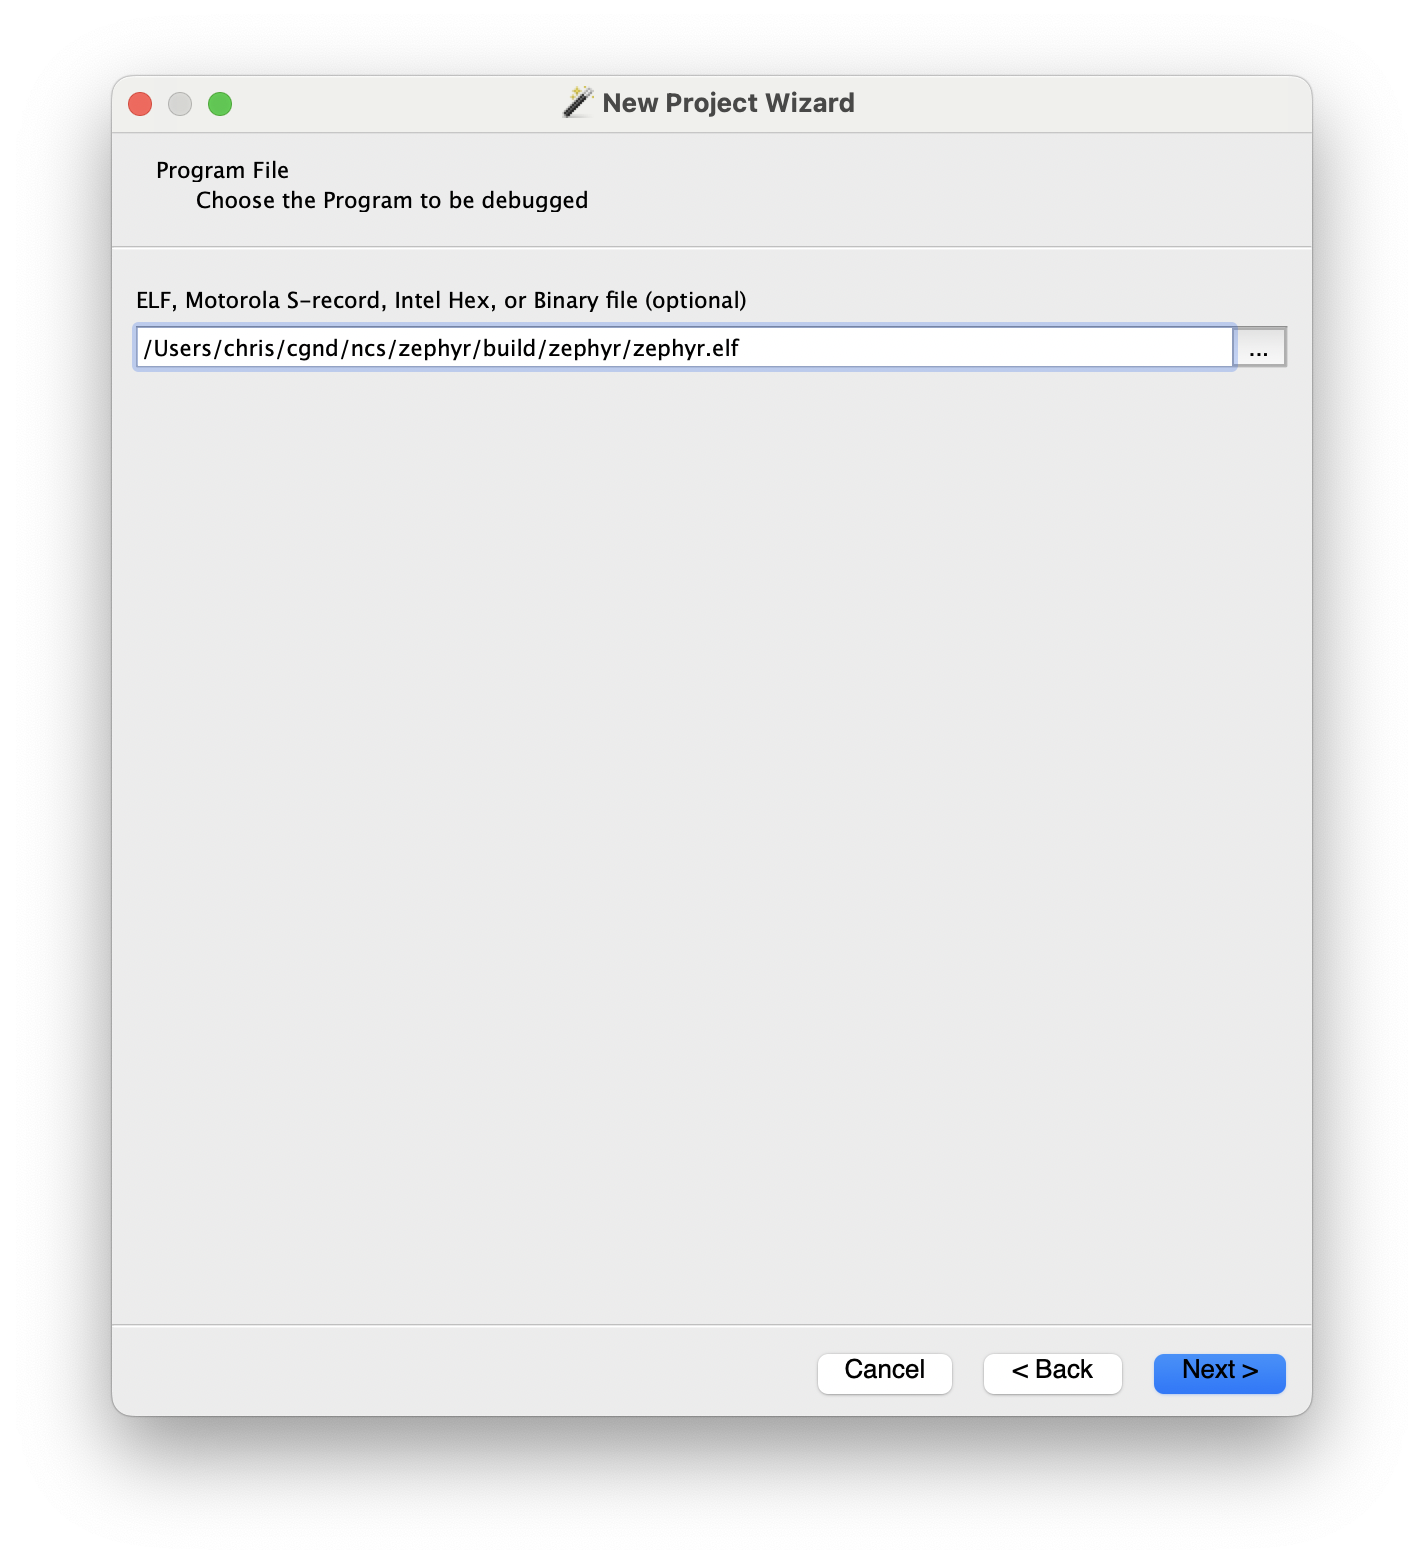
Select the build/zephyr/zephyr.elf ELF file we generated in the previous section:

Leave these fields the default values for now (we’ll update them later on):

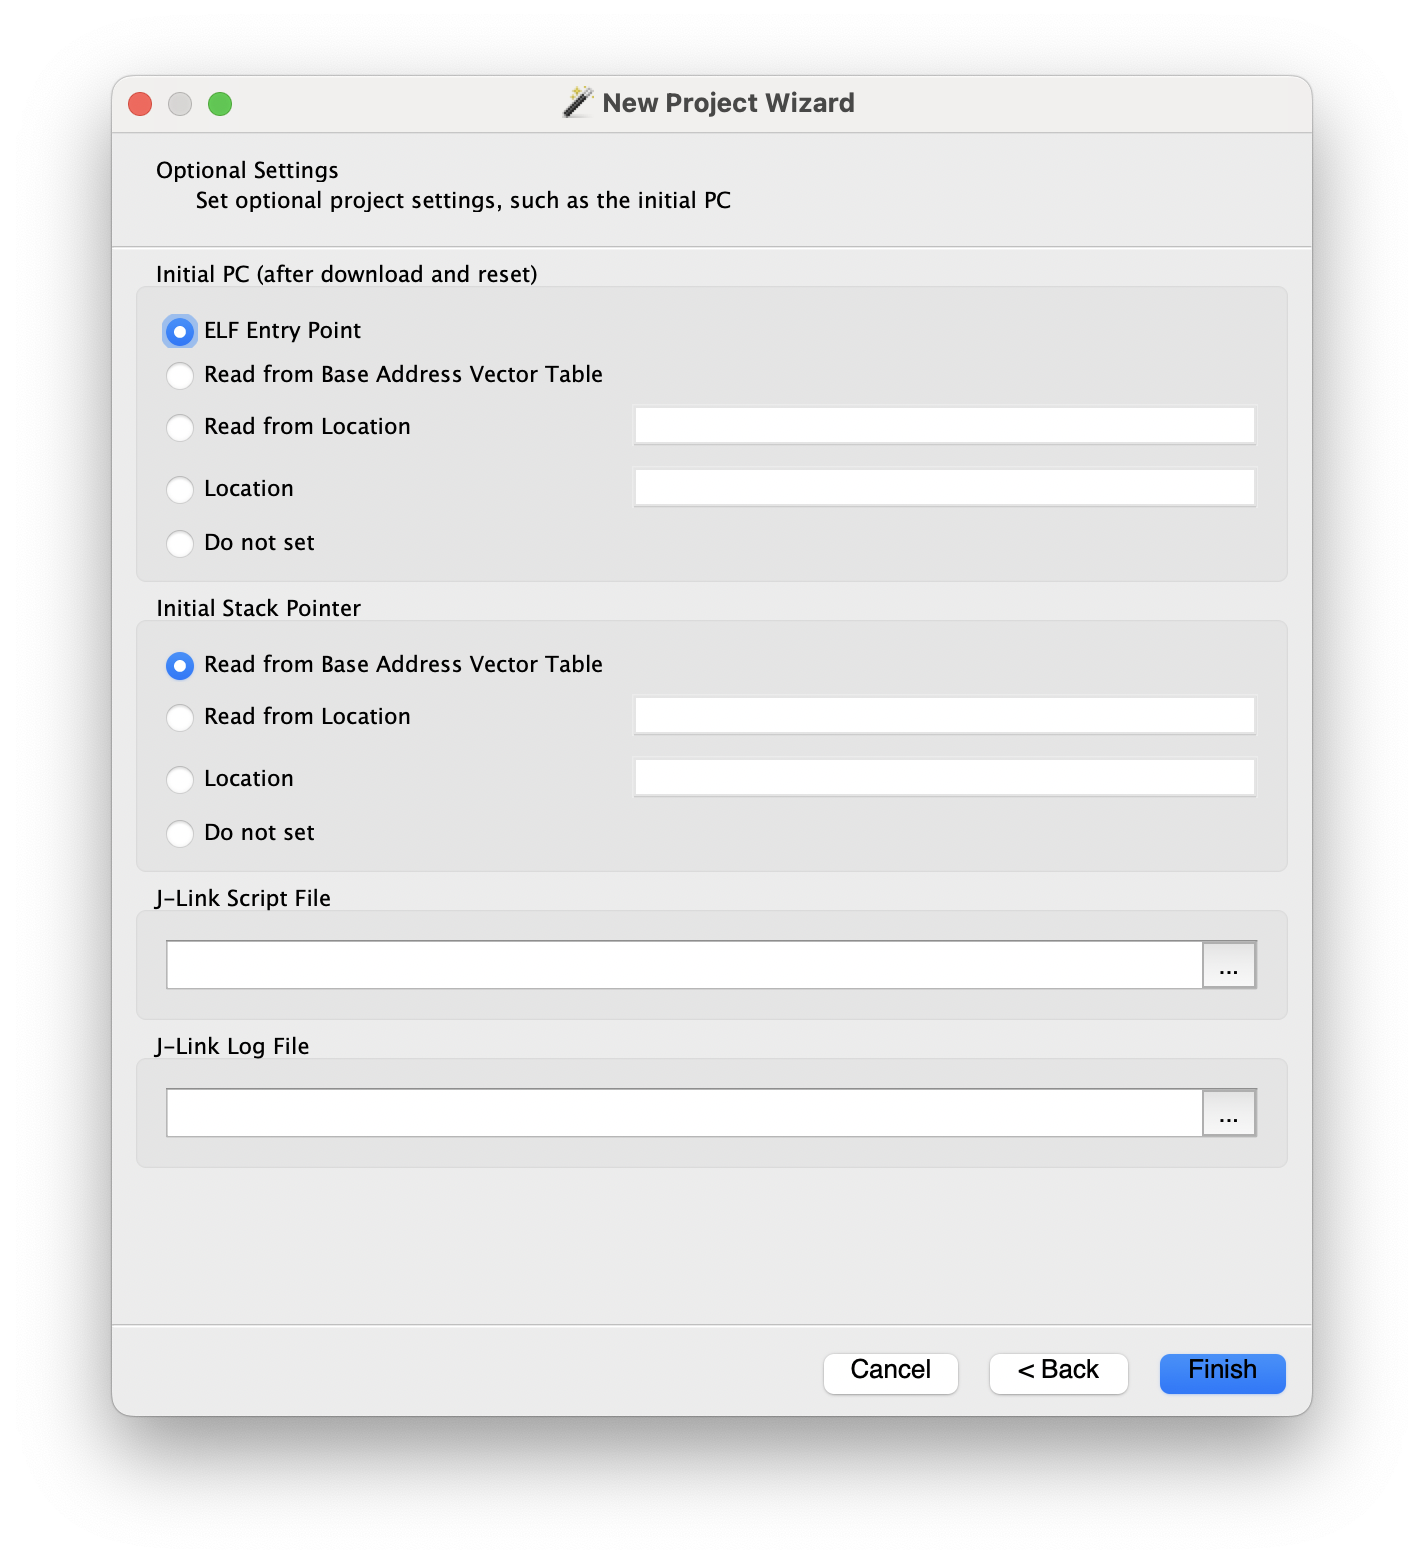
After clicking “Finish”, you’ll see the Ozone project window appear.

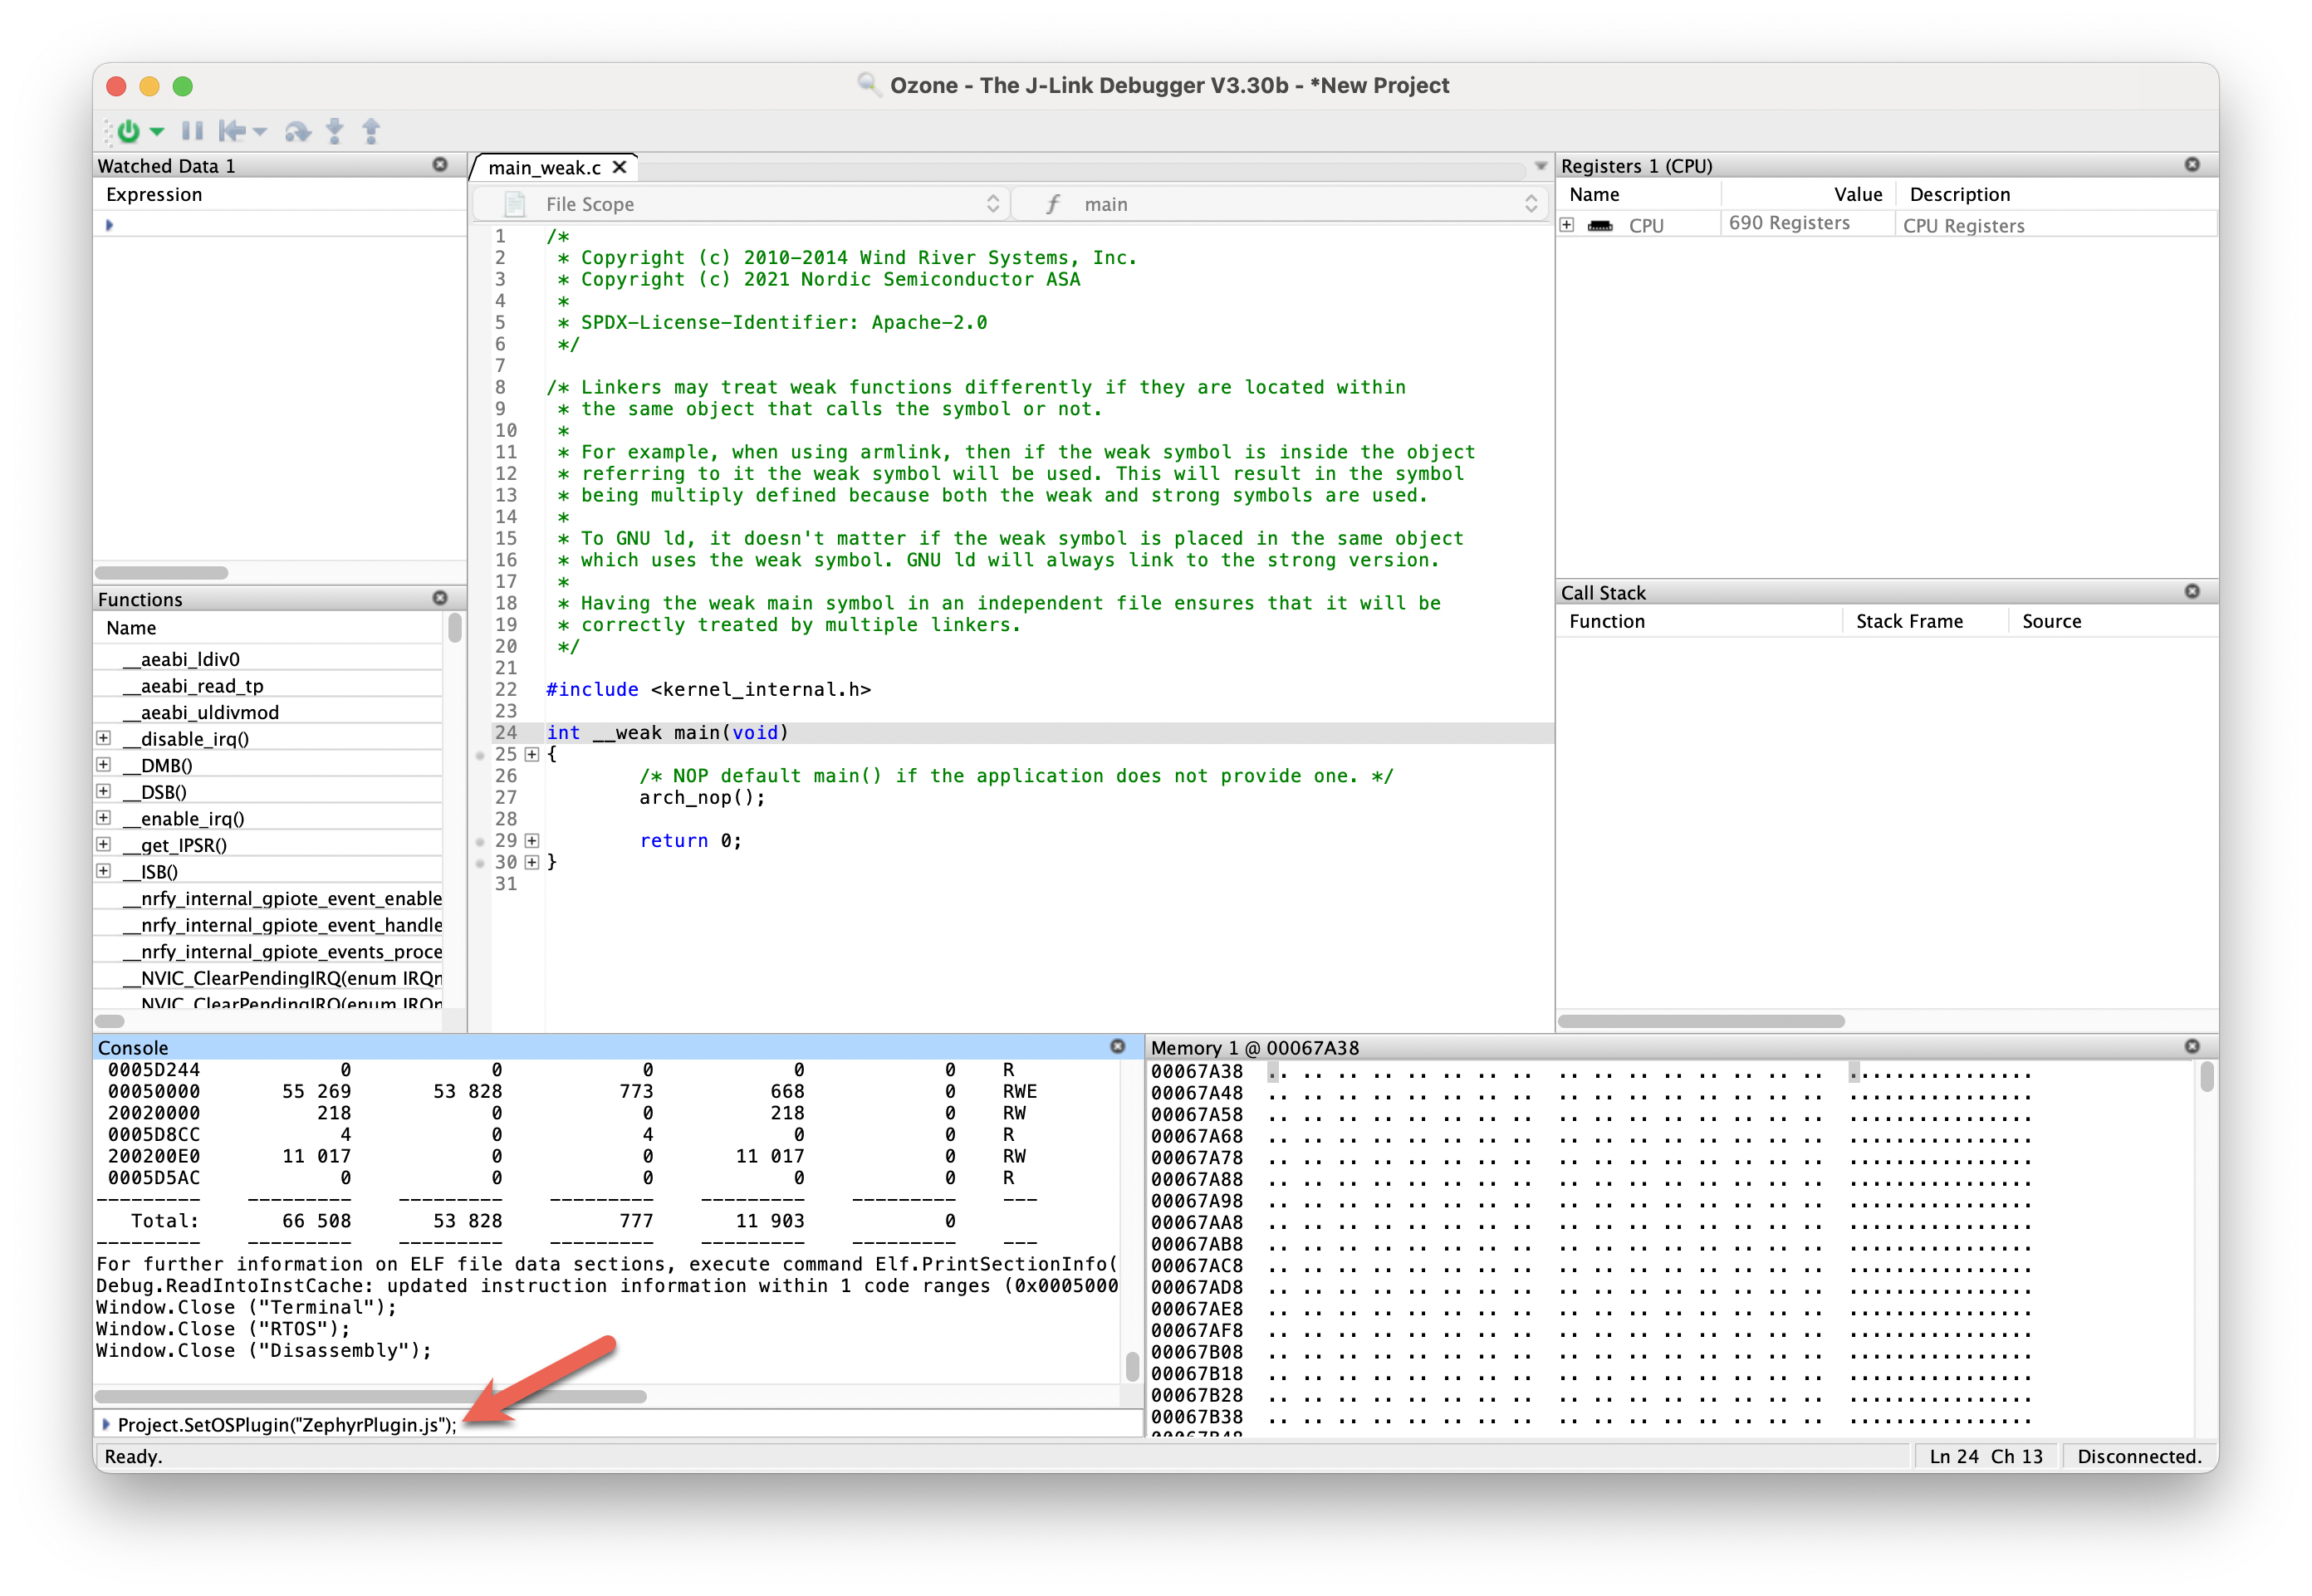
In the “Console” window, run the following command to load the Zephyr RTOS plugin:

Project.SetOSPlugin("ZephyrPlugin.js");

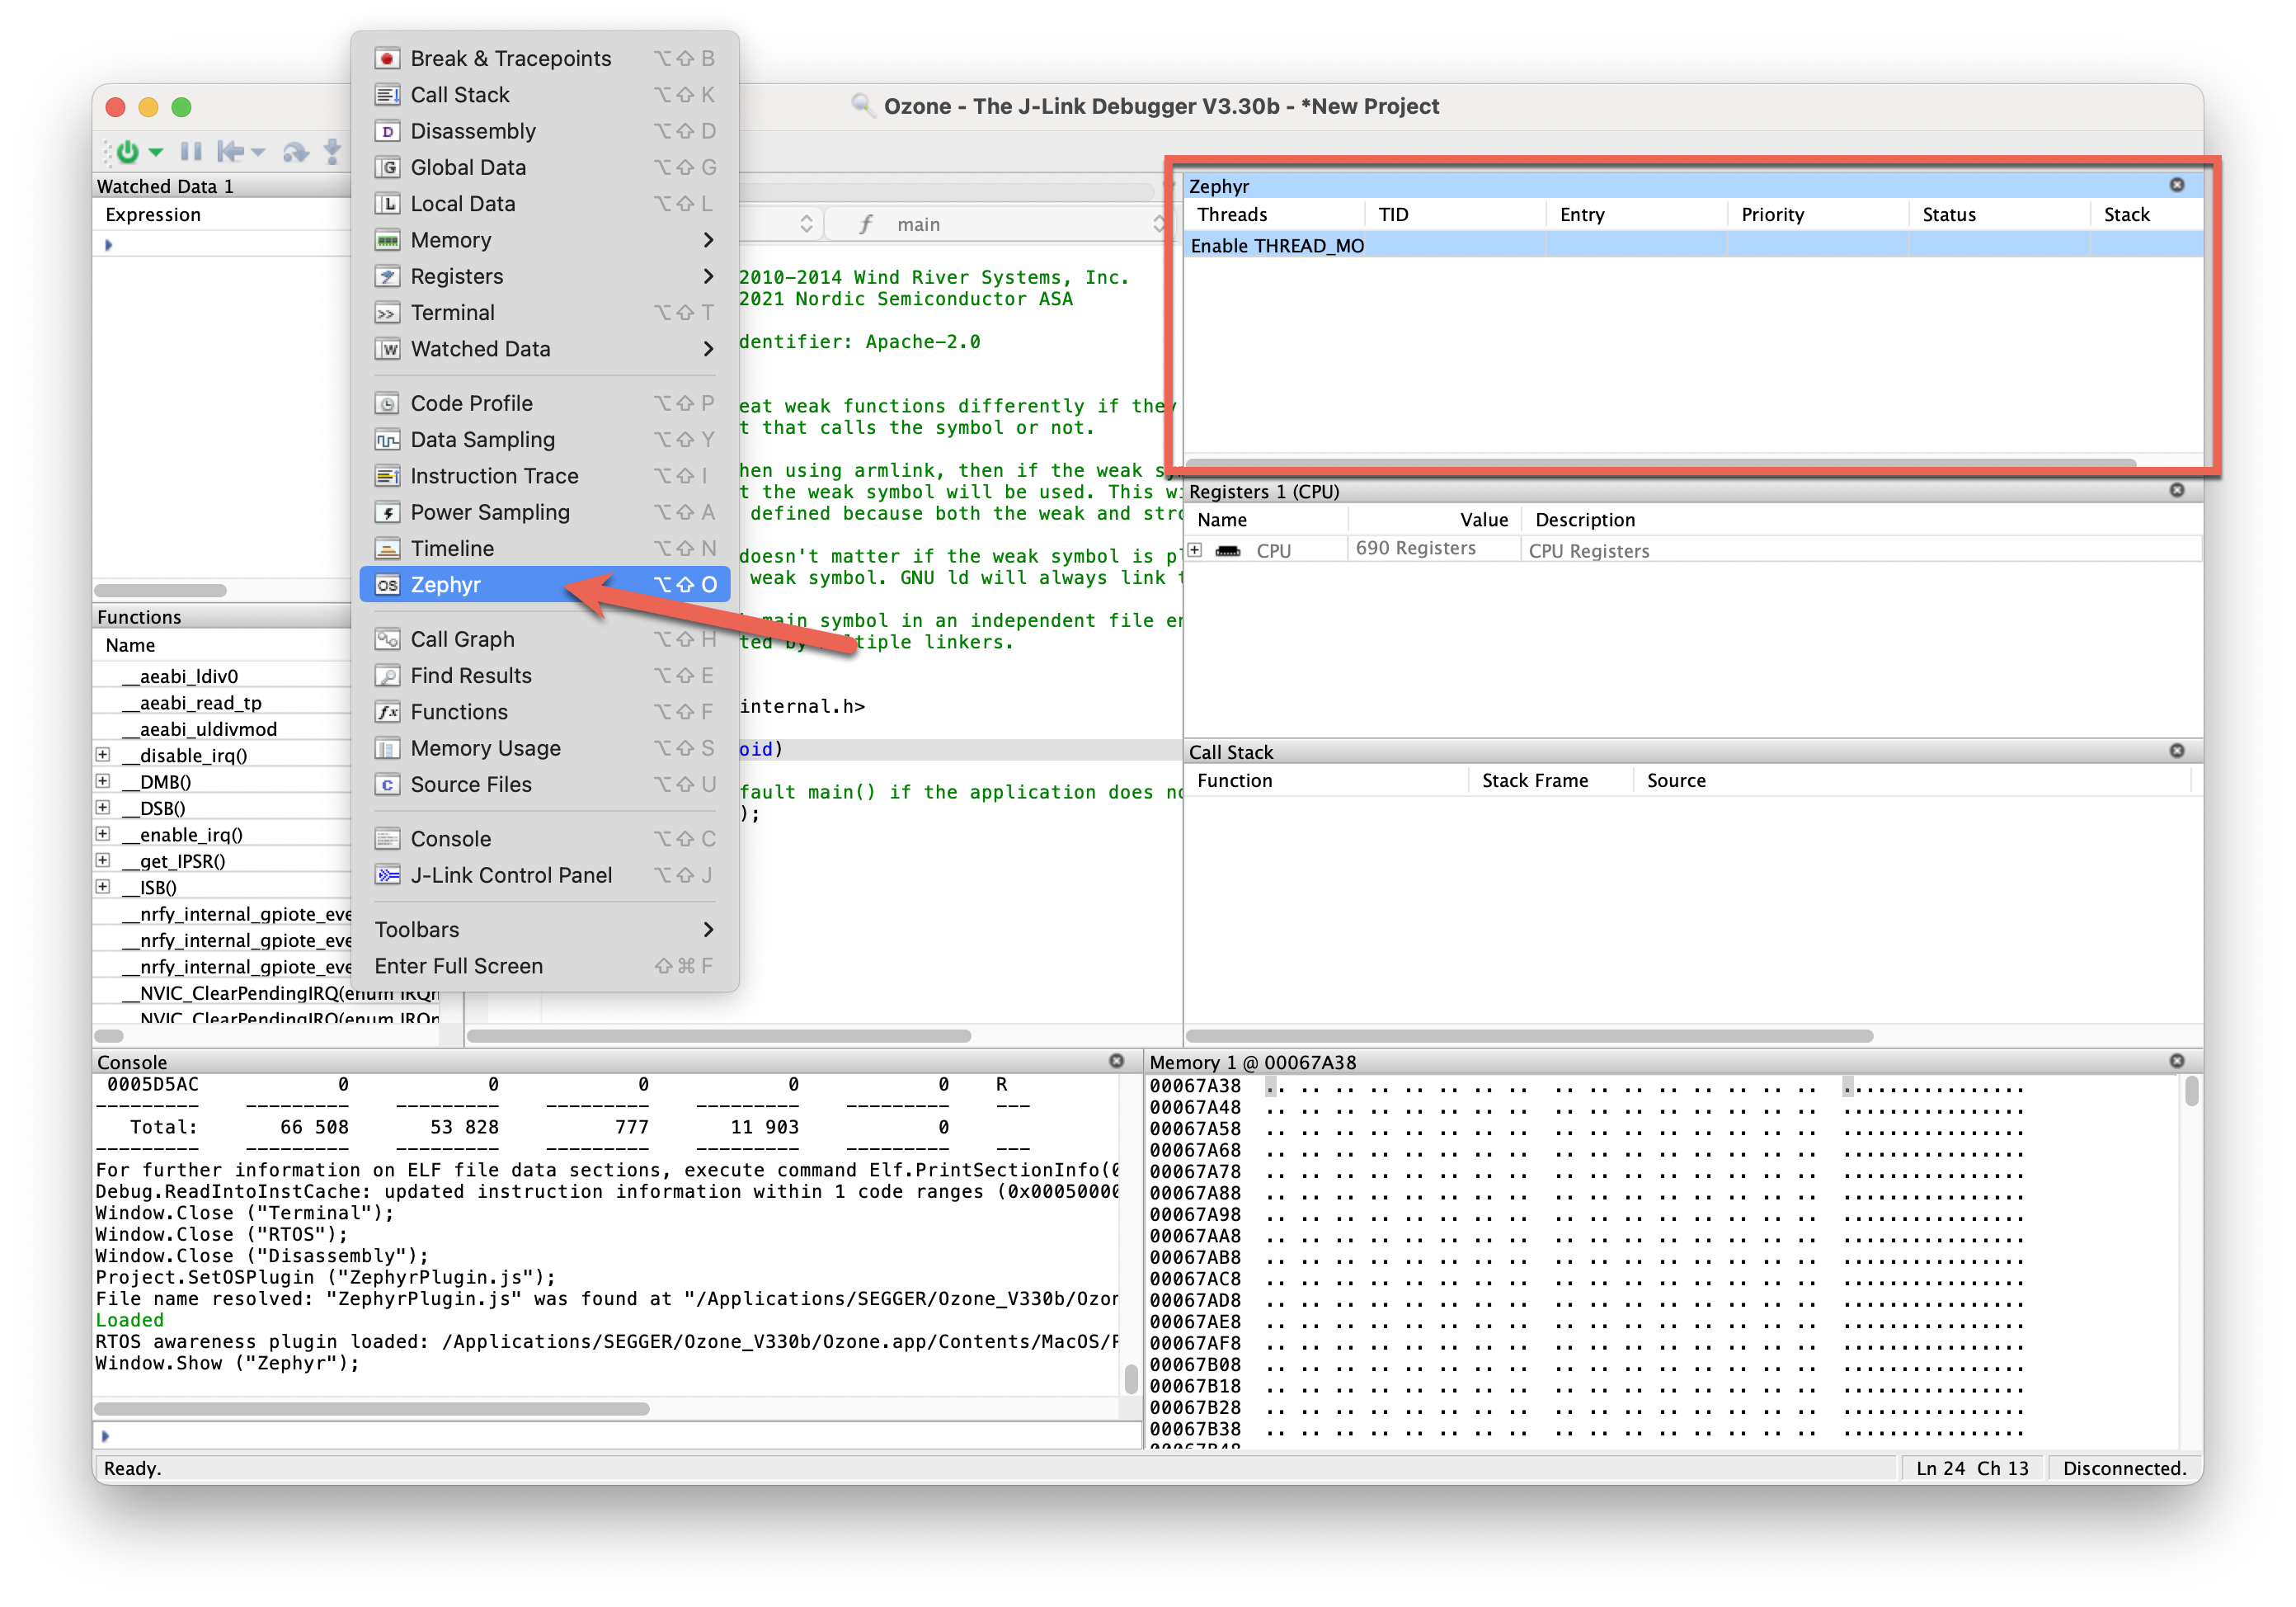
You should now see a new “Zephyr” window in the Ozone project (if not, click on “View” → “Zephyr” to show the window):

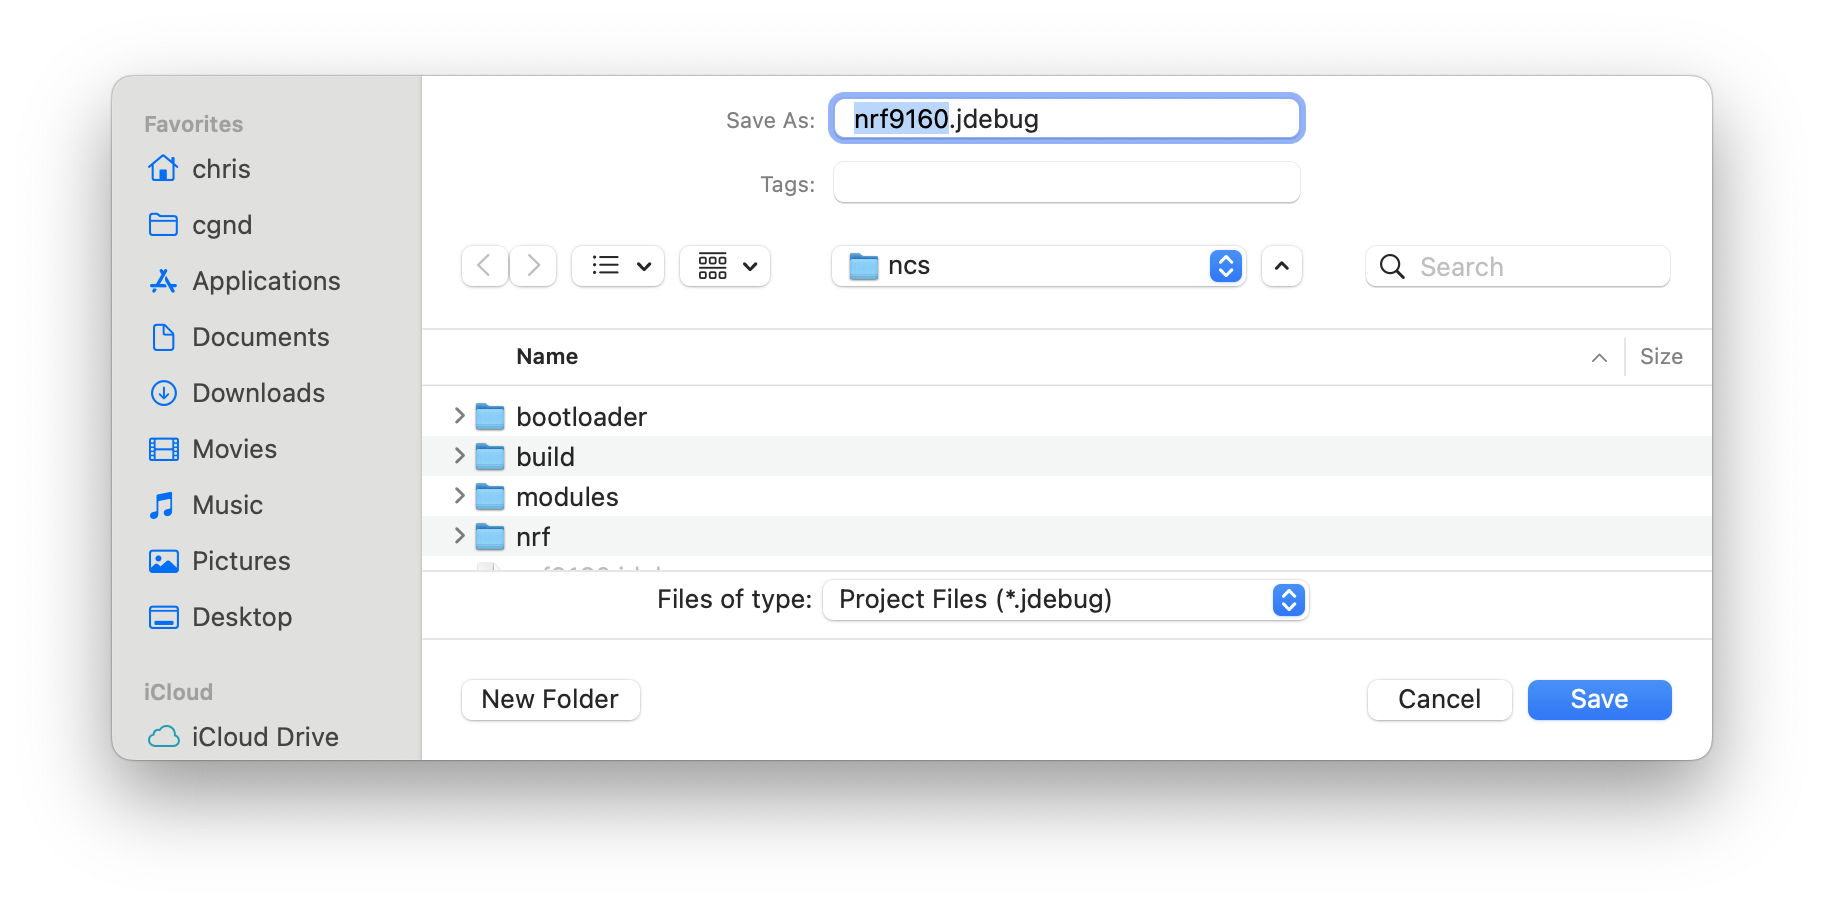
Finally, save the project file by clicking on “File” → “Save Project as…”:

Start the debug session

Now that we’ve configured the Ozone project, we can start the debug session.

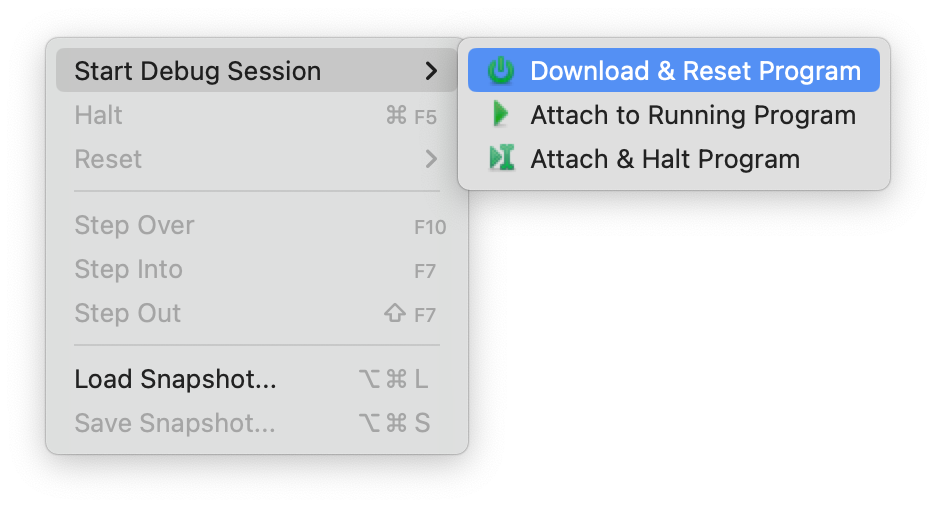
Click on “Debug” → “Start Debug Session” → “Download & Reset Program”:

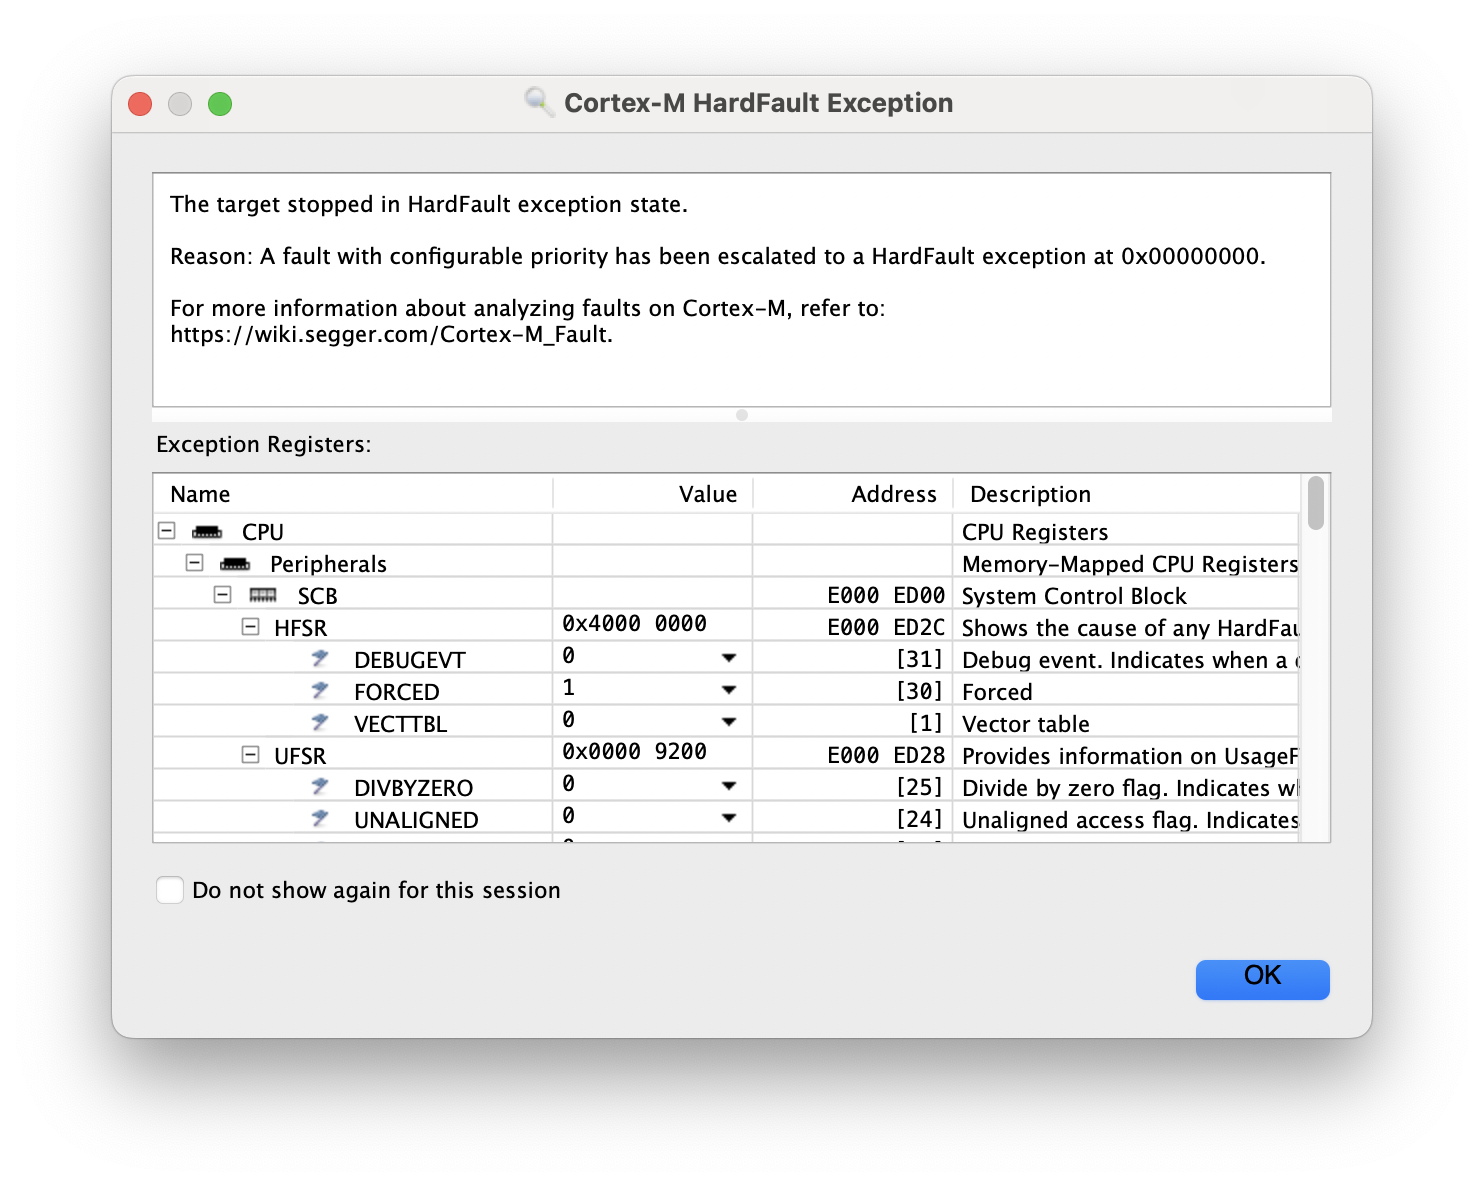
Surprise! When the firmware starts to run, you’ll see a pop-up window indicating that the target has stopped in a HardFault exception state!

At this point, you might be wondering what’s going on here…

We’ve followed the same basic steps as outlined in our previous article, so why isn’t this working for the nRF9160?

Here’s a hint: the answer has to do with multi-image builds.

The missing step: flashing the merged image

You may have noticed that the board argument we passed to west build (nrf9160dk_nrf9160_ns) ends in _ns. This suffix is an indicator that the firmware will be built with Trusted Firmware-M (TF-M). This is the reference implementation of ARM’s IoT Security Framework called Platform Security Architecture (PSA).

TFM uses the ARM TrustZone security features of the nRF9160’s Cortex-M33 MCU to partition the MCU into a Secure Processing Environment (SPE) and Non-Secure Processing Environment (NSPE).

Here’s how the boot process works in a nutshell:

  1. When the MCU boots up, it starts executing in the secure environment (SPE).
  2. The boot process can optionally start with a secure bootloader chain using NSIB and/or MCUboot.
  3. If used, the bootloader starts TF-M, which configures a part of the MCU memory and peripherals to be non-secure.
  4. TF-M starts your Zephyr application which runs in the non-secure environment (NSPE).

When we build for _ns build targets, the TF-M image is automatically built and linked with the Zephyr app. If you look in the build/zephyr/ output directory, you’ll see a file named merged.hex, which is a single merged file containing the MCUboot bootloader (optional), the TF-M secure image, and the non-secure Zephyr app.

west flash knows to flash the full merged image, but Ozone doesn’t do this by default!

We need to configure Ozone to load the full merged image and start execution in the secure environment.

Fixing the Ozone project file

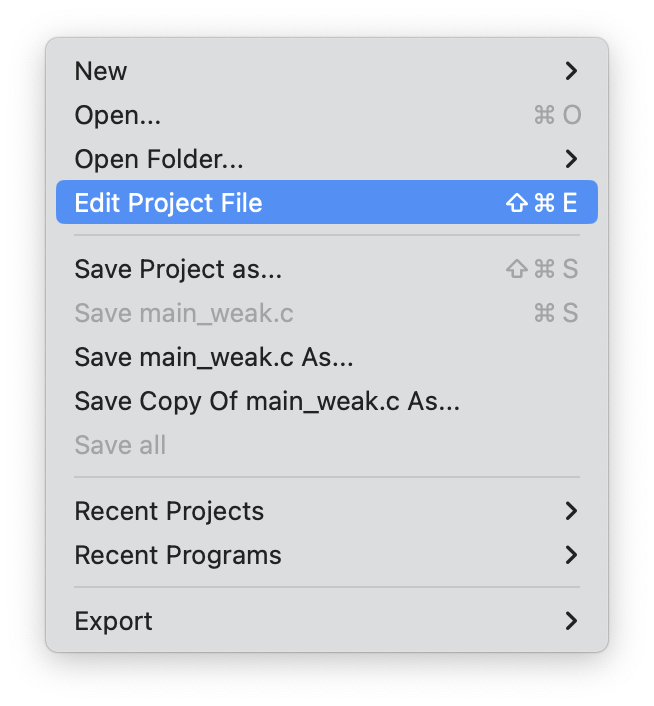
We’ll make a couple changes directly in the Ozone project file, which can be opened within Ozone by clicking “File” → “Edit Project File”:

Flash the merged image

Navigate to the TargetDownload section of the Ozone project file and add the following to configure Ozone to flash the merged image (changing the path to match the merged image file in your project):

/*********************************************************************
*
* TargetDownload
*
* Function description
* Replaces the default program download routine. Optional.
*
**********************************************************************
*/
void TargetDownload(void)
{
  Exec.Download("$(ProjectDir)/build/zephyr/merged.hex");
}

Fix the Vector Table & PC addresses

Navigate to the _SetupTarget section of the Ozone project file and make the following changes:

  1. Set the vector table address to 0
  2. Read the entry point program counter address from the vector table
/*********************************************************************
*
*       _SetupTarget
*
* Function description
*   Setup the target.
*   Called by AfterTargetReset() and AfterTargetDownload().
*
*   Auto-generated function. May be overridden by Ozone.
*
**********************************************************************
*/
void _SetupTarget(void) {
  unsigned int SP;
  unsigned int PC;
  unsigned int VectorTableAddr;

  VectorTableAddr = 0;
  //
  // Set up initial stack pointer
  //
  SP = Target.ReadU32(VectorTableAddr);
  if (SP != 0xFFFFFFFF) {
    Target.SetReg("SP", SP);
  }
  //
  // Set up entry point PC
  //
  PC = Target.ReadU32(VectorTableAddr + 4);
  if (PC != 0xFFFFFFFF) {
    Target.SetReg("PC", PC);
  } else {
    Util.Error("Project script error: failed to set up entry point PC", 1);
  }
}

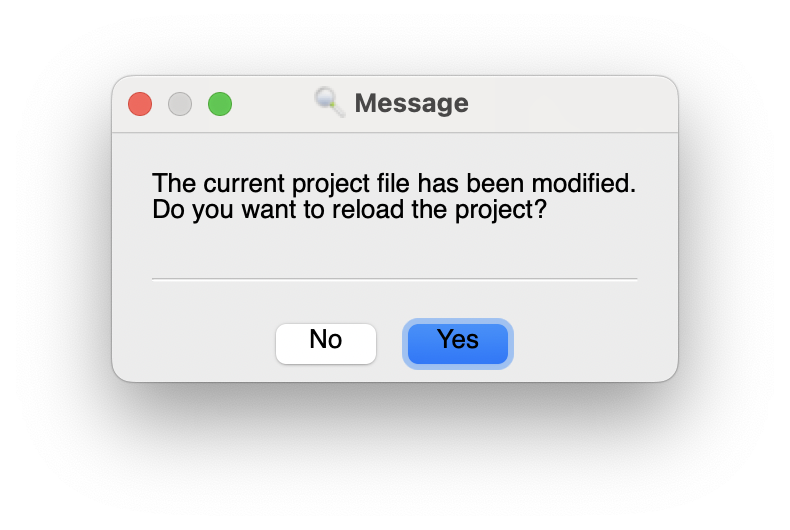
When you save the project file, you should get a modal pop-up asking if you want to reload the project.

Choose “Yes”:

Restart the debug session:

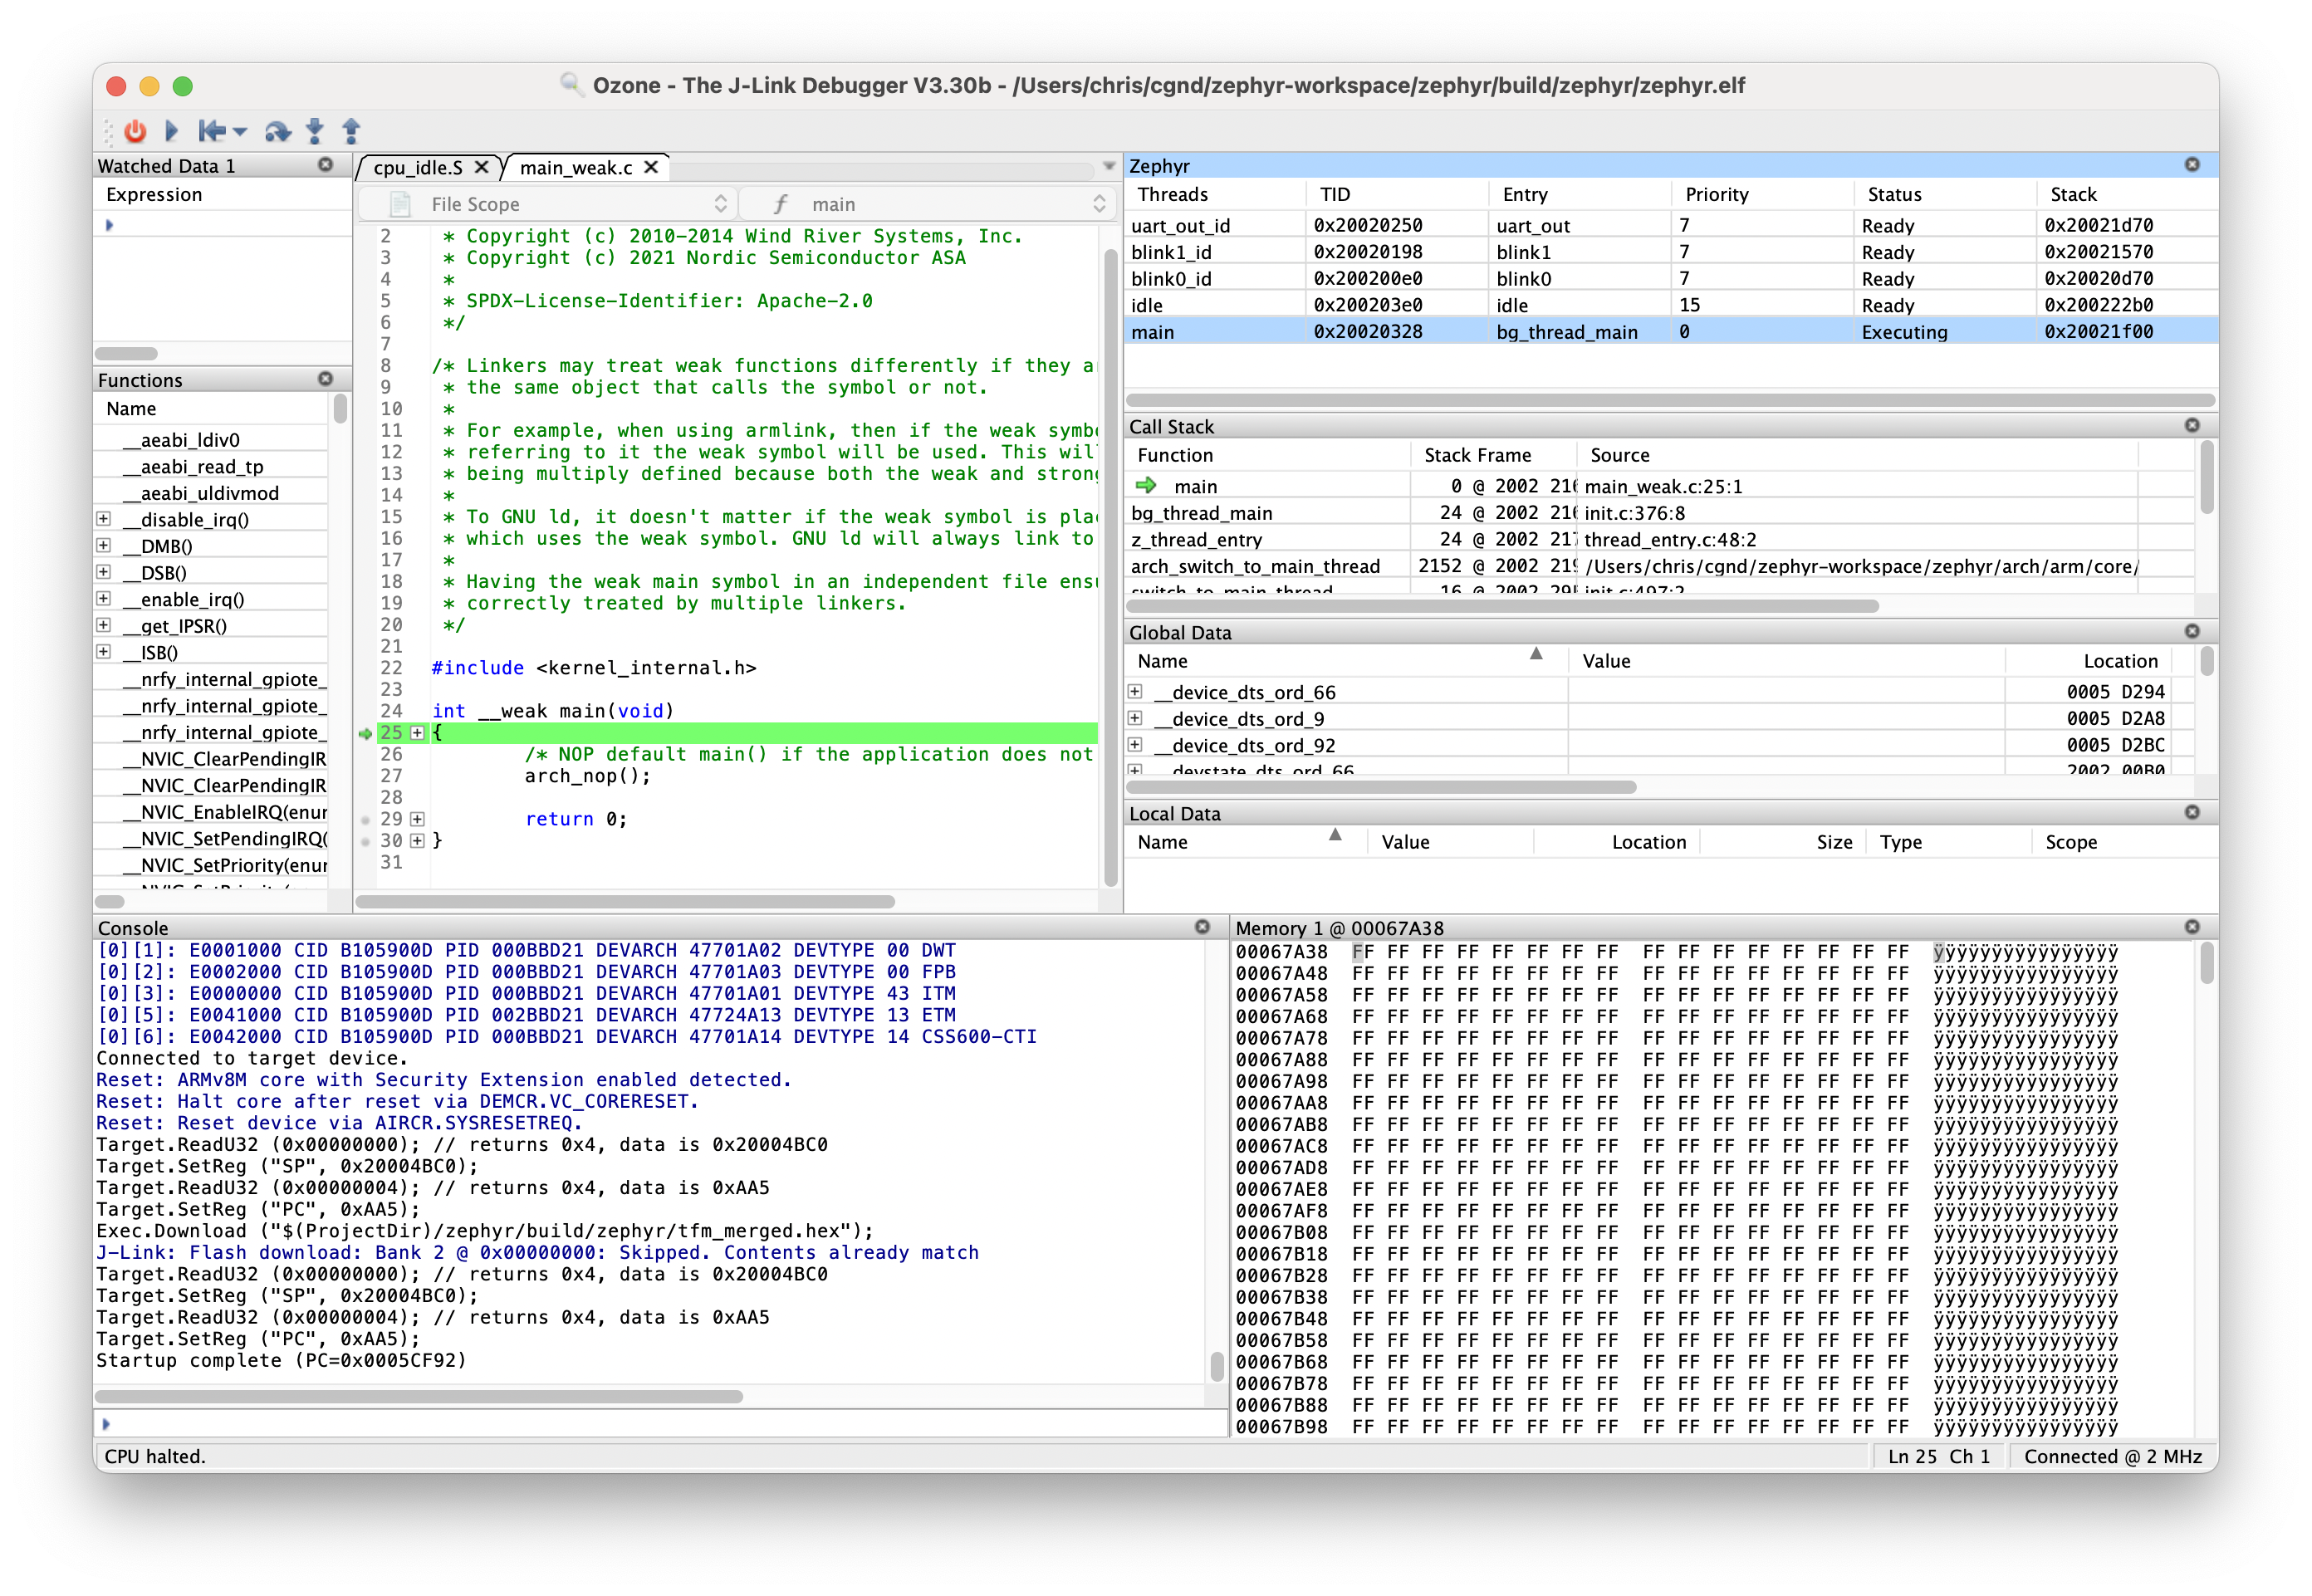
After the image has been flashed to the device, you should see the debugger halted at main:

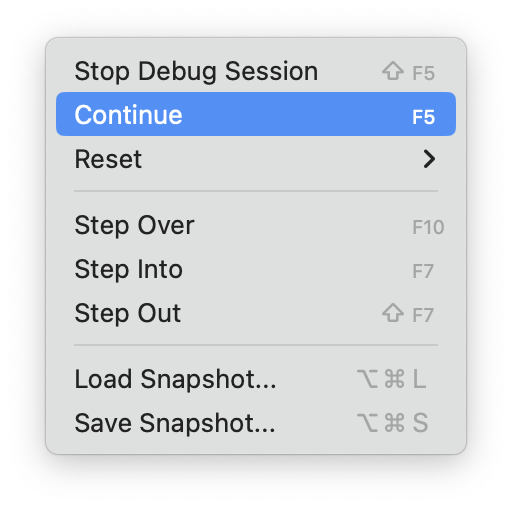
Click “Debug” → “Continue”:

The firmware should now run without exceptions!

Summary

Hopefully this helped you get started debugging the nRF9160 with Ozone.

The nRF9160 is fully supported in Zephyr, and has the highest level of support in the Golioth IoT device management platform (Continuously Verified). With Golioth, you can connect and secure your devices, send sensor data to the web, update firmware over-the-air, and scale your fleet with an instant IoT cloud.

Try it today—with Golioth’s Dev tier your first 50 devices are free!

Embedded developers always maintain sets of helper code that get used across multiple projects. With Zephyr RTOS, you can easily turn your helper code into a portable Zephyr module.

Creating a Zephyr module means you can version control your code, making changes in one centralized place, while targeting a specific git commit, tag, or branch of that code in a project. You only need to add two or three additional files to qualify as a Zephyr module. And once the module is published you can make the code available to your Zephyr projects simply by adding it to your manifest file.

A Working Example

Ostentus faceplate installed on Aludel-mini reference design

You may remember reading about Ostentus, Golioth’s custom faceplate for conference demos. This I2C display can be added to any Zephyr project by leveraging some helper code that simplifies sending data from the device to the faceplate. As this code will change in the future, it isn’t maintainable to copy it between projects, so we turned it into a Zephyr module. Let’s use this as an example. Here are the steps:

  1. Create a new repository to store your helper code
  2. Add a CMake file and an optional Kconfig file
  3. Add a module.yml file that tells Zephyr where to find files in the module repo

That creates the module, and the final step is to add it to your project’s West manifest.

1. Create a new repository

For our example, we have just one C file and one header file. I created a new repository to store these files. Place the header file in a directory named include; you may add subdirectories if you want there be a category-like prefix when the header is included (e.g. #include <yoursubdirectory/yourfile.h>).

Here are the important parts of my tree for this module:

➜ tree
.
├── include
│   └── libostentus.h
└── libostentus.c

2. Add CMake and Kconfig files

Next we need to add a CMake file to include our source code in the build. You also have the option of including a Kconfig file. I’m going to do this optional step because it allows me to create a symbol that will turn on or off this library in the project build.

First, I create the Kconfig file in the root of the repo that adds a unique symbol (LIB_OSTENTUS) for this library:

config LIB_OSTENTUS
    bool "Enable the helper library for the Golioth Ostentus faceplate"
    default n
    depends on I2C
    help
      Helper functions for controlling the Golioth Ostentus faceplate.
      Features include controlling LEDs, adding slides and slide data,
      enabling slideshows, etc.

Next, I add the C file and the header file to the build using a CMakeLists.txt file in the root directory of the repository. Note that this uses the Kconfig symbol created in the last step to decide whether or not to build with these files.

if (CONFIG_LIB_OSTENTUS)
  zephyr_include_directories(include)
  zephyr_library_sources(libostentus.c)
endif()

3. Add module.yml

The glue that holds this together is the module.yml file, which must be placed in a zephyr subdirectory of the repository. Here I tell it where to look for the CMake and Kconfig files, although there are other options that can be added to this file.

build:
  cmake: .
  kconfig: Kconfig

I find the relative paths of this file to be a bit confusing. But the gist of it is that this file will be located at zephyr/module.yml and the paths in the file are based on the parent of that zephyr subdirectory.

Congratulations, we now have a Zephyr module made up of the following files:

➜ tree
.
├── CMakeLists.txt
├── include
│   └── libostentus.h
├── Kconfig
├── libostentus.c
└── zephyr
    └── module.yml

Using the Module in a Zephyr Project

Using the newly created module follows the familiar Zephyr pattern of adding it to the projects section of your West manifest file. (You can find your manifest file by running west manifest --path.)

manifest:
  projects:
    - name: libostentus
      path: modules/lib/libostentus
      revision: v1.0.0
      url: https://github.com/golioth/libostentus

self:
  path: app

Calling west update will now checkout the helper code and place it in modules/lib/libostentus. Remember that I added a Kconfig symbol in my example, so I need to add that to the project prj.conf file or a <board>.conf file to include this code in the build.

CONFIG_LIB_OSTENTUS=y

Using the module in your C files is a simple matter of adding the #include and then calling the functions.

#include <libostentus.h>

int main(void)
{
    clear_memory();
    show_splash();

    k_sleep(K_FOREVER);
}

Summary

Golioth supports a wide variety of hardware and use cases, and part of our strategy to make that scalable is to write and maintain modular code. The Golioth Zephyr SDK is a Zephyr module, which makes it easy to include in your project and easy to lock to a known version until you’re ready to upgrade to a newer version. We’ve used this same Zephyr module approach for helper code when building our numerous reference designs. It works well and I encourage you to adopt modular practices for your own work.

This process of creating a Zephyr module is a nice improvement over copying and pasting code between projects because it implements reliable revision control. It is also an intermediary step between implementing a project-specific driver, and creating a modular Zephyr driver. The Ostentus faceplate should eventually be converted to a full Zephyr driver, and enabled directly from Devicetree. But that’s a post for another day!

In the meantime, if you find yourself in need of a device management service with robust OTA, data handling, fleet settings, RPC, and more, give us a try. With Golioth’s Dev tier your first 50 devices are free!

Golioth collects data from your entire IoT sensor fleet and makes it easy to access from the cloud. Data visualization is a common use case and we love using Grafana to make dashboards for our fleets. It can start to get tricky if your devices are sending back mountains of different data. We’ll demonstrate how you can use Golioth REST API Queries to capture specific data endpoints from devices. By doing so, you can focus on the most important data points and utilize them to create powerful visual dashboards in Grafana.

Don’t Mix Your Endpoints

By far the easiest way to query streaming sensor data is just to ask for all of the events. But this presents an interesting challenge in Grafana. If your query response includes records that don’t have your desired endpoint, Grafana will see that as null and most often this will break your graph:

Grafana error screenshot

Grafana showing the “Fields have different lengths” error

This is because the graph is targetting the sensor endpoint, but if we look at Golioth we can see that the device is sending data to the battery endpoint in between sensor readings. The sensor endpoint doesn’t exist for those readings.

Battery and sensor data being received on Golioth's LightDB Stream service

Let’s diagnose, and fix this issue using the Query Builder button in the upper right of the LightDB Stream page of the Golioth Console.

Using Query Builder to Filter Data

As it stands now, the query is asking for all data from all events by using the * wildcard operator:

Query Builder getting all endpoints

What we really want is just one endpoint that we can graph (along with the time and deviceId). So let’s change the query builder to target the current measurement on channel 0 of the incoming sensor data. I’ll also use an alias to make it easy to access the returned value.

Targeting the sensor.cur.ch0 endpoint

This is a good start. But if you look at the data, we still haven’t solved the problem:

Golioth LightDB endpoints sometimes null

The dashes are the null values returned when trying to query our sensor data when it was a battery endpoint that was received. The final part of the puzzle is to add a filter that checks that our desired endpoint is not null.

Filtering out null values on an endpoint Now Golioth will only send data that includes the value we want to graph:

Correctly filtered sensor value

Now that we are receiving exactly the data we need, we can copy the query from the Query Builder by clicking the JSON button and then the Copy button.

Using the Query in Grafana

We previously set up a REST API data source for Golioth in our Grafana Dashboard. Use the Body tab to enter your query using the new values we created with the Query Builder.

Grafana JSON query

In the Fields tab we’re using the alias that we specified. You could use the full endpoint but as your panels become more intricate you’ll thank yourself for using aliases!

Fields for graphing values in Grafana

For completeness, we’ll leave you with the verbose body object from this Grafana panel. You can see the parts we crafted in the Query Builder make up the query field.

{
  "start": "${__from:date}",
  "end": "${__to:date}",
  "perPage": 99999,
  "query": {
    "fields": [
      {
        "path": "time"
      },
      {
        "path": "deviceId"
      },
      {
        "path": "sensor.cur.ch0",
        "alias": "cur0"
      }
    ],
    "filters": [
      {
        "path": "sensor.cur.ch0",
        "op": "<>",
        "value": "null"
      }
    ]
  }
}

Give Golioth a Try Today!

The proof of concept for your IoT fleet can be up and running in days, not weeks if you use Golioth as your instant IoT cloud. Combined with visualization tools like Grafana, you’ll have no problem getting to “yes” with your customers (or your boss). Your first 50 devices are free with our Dev Tier, so give Golioth a try today!

Cellular-enabled devices are often deployed into far-flung locations. They are quite likely to be out of reach from physical access once deployed. Having a way to verify the network status for a device is really important to maintaining a fleet.

Nordic Semiconductors (makers of the nRF9160) built tools for returning cellular connection info into the nRF Connect SDK, their customized flavor of Zephyr. This week, we needed to retrieve cellular network info for a project. We want to share the joy of how convenient and useful this is for fleet operations.

What’s there to know about the nRF9160 Modem?

The primary info most people want from a cellular modem is the Reference Signal Received Power (RSRP). This a measure of how strong the signal from the cell tower is, and for battery-powered operations this is crucial.

For instance, let’s say you want to perform a firmware update that will download a (relatively) large amount of data. The stronger the RSRP, the more likely that packets will be received quickly and without the need to resend. Better throughput means less radio-on time for a lower power draw.

Modem Info pulled using a Golioth Remote Procedure Call

Modem Info returned using a Golioth Remote Procedure Call (RPC)

However, this is only one info item and one use example. You may want to know what type of network you’re on, which band you’re using, which bands are available, or gather device specific information like IMEI. This is all possible! Let’s walk through the Nordic Modem Info library together!

Using the Nordic Modem Info Library with Zephyr

First off, you should be using nRF Connect SDK (NCS), the Nordic flavor of Zephyr. We have a guide for setting up an NCS workspace if you need it. Using the Modem Info library is pretty straightforward. All of the steps below were found on the Nordic Modem information documentation.

1. Enable Modem Info in Kconfig

Make sure the library is built into the project by adding its Kconfig symbol in prj.conf:

CONFIG_MODEM_INFO=y

2. Initialize the Modem Info Library

You need to initialize the library before you can use it. We recommend initializing this when the app starts running, so place this call near the top of main:

int err = modem_info_init();
if (err) {
    LOG_ERR("Failed to initialize modem info: %d", err);
}

3. Use the modem_info enum to access desired data

Now we’re ready to grab data from the Modem Info library. There is a modem_info enum that contains all possible keys. The code below pulls (almost) all of those keys/values as strings and prints them out as logs.

int network_info_log(void)
{
    LOG_DBG("====== Cell Network Info ======");
    char sbuf[128];
    modem_info_string_get(MODEM_INFO_RSRP, sbuf, sizeof(sbuf));
    LOG_DBG("Signal strength: %s", sbuf);

    modem_info_string_get(MODEM_INFO_CUR_BAND, sbuf, sizeof(sbuf));
    LOG_DBG("Current LTE band: %s", sbuf);

    modem_info_string_get(MODEM_INFO_SUP_BAND, sbuf, sizeof(sbuf));
    LOG_DBG("Supported LTE bands: %s", sbuf);

    modem_info_string_get(MODEM_INFO_AREA_CODE, sbuf, sizeof(sbuf));
    LOG_DBG("Tracking area code: %s", sbuf);

    modem_info_string_get(MODEM_INFO_UE_MODE, sbuf, sizeof(sbuf));
    LOG_DBG("Current mode: %s", sbuf);

    modem_info_string_get(MODEM_INFO_OPERATOR, sbuf, sizeof(sbuf));
    LOG_DBG("Current operator name: %s", sbuf);

    modem_info_string_get(MODEM_INFO_CELLID, sbuf, sizeof(sbuf));
    LOG_DBG("Cell ID of the device: %s", sbuf);

    modem_info_string_get(MODEM_INFO_IP_ADDRESS, sbuf, sizeof(sbuf));
    LOG_DBG("IP address of the device: %s", sbuf);

    modem_info_string_get(MODEM_INFO_FW_VERSION, sbuf, sizeof(sbuf));
    LOG_DBG("Modem firmware version: %s", sbuf);

    modem_info_string_get(MODEM_INFO_LTE_MODE, sbuf, sizeof(sbuf));
    LOG_DBG("LTE-M support mode: %s", sbuf);

    modem_info_string_get(MODEM_INFO_NBIOT_MODE, sbuf, sizeof(sbuf));
    LOG_DBG("NB-IoT support mode: %s", sbuf);

    modem_info_string_get(MODEM_INFO_GPS_MODE, sbuf, sizeof(sbuf));
    LOG_DBG("GPS support mode: %s", sbuf);

    modem_info_string_get(MODEM_INFO_DATE_TIME, sbuf, sizeof(sbuf));
    LOG_DBG("Mobile network time and date: %s", sbuf);

    LOG_DBG("===============================");

    return 0;
}

Here’s what the log messages look like after this code runs:

[00:00:07.457,733] <dbg> net_info: network_info_log: ====== Cell Network Info ======
[00:00:07.458,648] <dbg> net_info: network_info_log: Signal strength: 54
[00:00:07.459,411] <dbg> net_info: network_info_log: Current LTE band: 12
[00:00:07.459,960] <dbg> net_info: network_info_log: Supported LTE bands: (1,2,3,4,5,8,12,13,18,19,20,25,26,28,66)
[00:00:07.460,906] <dbg> net_info: network_info_log: Tracking area code: 4311
[00:00:07.461,395] <dbg> net_info: network_info_log: Current mode: 2
[00:00:07.461,944] <dbg> net_info: network_info_log: Current operator name: 310410
[00:00:07.462,890] <dbg> net_info: network_info_log: Cell ID of the device: 0494980F
[00:00:07.464,050] <dbg> net_info: network_info_log: IP address of the device: 100.71.101.177
[00:00:07.464,965] <dbg> net_info: network_info_log: Modem firmware version: mfw_nrf9160_1.3.2
[00:00:07.465,850] <dbg> net_info: network_info_log: LTE-M support mode: 1
[00:00:07.466,735] <dbg> net_info: network_info_log: NB-IoT support mode: 0
[00:00:07.467,407] <dbg> net_info: network_info_log: GPS support mode: 0
[00:00:07.468,170] <dbg> net_info: network_info_log: Mobile network time and date: 23/05/19,18:48:15-20
[00:00:07.468,170] <dbg> net_info: network_info_log: ===============================

Of course, it’s not just for printing out string, there are many functions for using this information programmatically.

How Golioth is Using the Modem Info Library

Our initial use for this is purely informational. As we test devices in the field, we want to have access to cell tower information that will be helpful in troubleshooting. We could just set up a timer to periodically call our log function; since Golioth has a remote logging feature, all logs will be sent and retained on the servers. What about when we want to know this modem info on-demand?

This is perfect use-case for a Remote Procedure Call (RPC). The one tripping point I had during implementation is that the initialization function must run outside of any interrupts to avoid hard faults. With that ironed out, it was a simple matter of adding the information to the RPC response package.

static enum golioth_rpc_status on_get_network_info(QCBORDecodeContext *request_params_array,
                        QCBOREncodeContext *response_detail_map,
                        void *callback_arg)
{
    QCBORError qerr;

    qerr = QCBORDecode_GetError(request_params_array);
    if (qerr != QCBOR_SUCCESS) {
        LOG_ERR("Failed to decode array items: %d (%s)", qerr, qcbor_err_to_str(qerr));
        return GOLIOTH_RPC_INVALID_ARGUMENT;
    }

    char sbuf[128];
    modem_info_string_get(MODEM_INFO_RSRP, sbuf, sizeof(sbuf));
    QCBOREncode_AddSZStringToMap(response_detail_map,
                     "Signal strength",
                     sbuf);

    return GOLIOTH_RPC_OK;
}

The syntax is not all that different from logging the information. In this case I’m using a QCBOR helper function to add the RSRP reading to the data that will be returned to Golioth. This ensures the serialization of the packets is as efficient as possible.

Once all of the values I’m interested in are added this way, they are present in the data object returned from the RPC:

What will you use the Modem Info library for?

We’d love to hear what you are using the modem info for in your projects. Start a thread in the Golioth Forum to show off your work!

Visual Studio Code, colloquially known as VScode, is among the most popular integrated development environments (IDEs). Today we’re going to walk through the process of setting up ESP-IDF in VScode and using it to run Golioth device management example code on an ESP32.

Not everyone likes to live their lives hammering away at a command prompt. What we’ll cover today is another option which uses Espressif’s VScode extension (plugin) to largely automate how you work with the Espressif IoT Development Framework (ESP-IDF). That means nice buttons and interfaces to build, flash, and monitor applications for the ESP32 family of chips.

Installing VScode and the ESP-IDF extension

As a prerequisite you will need to have VScode installed. If you don’t, head over to the download page and do so now.

ESP-IDF VScode extension

Open VScode and click on the extensions icon (looks like four boxes) on the left sidebar. Type esp-idf into the search bar that appears and the top result will be “Espressif IDF”. Click the install button and you’re off to the races.

Configure ESP-IDF VScode Extension

You will be greeted with options for installing the various ESP-IDF tools. If you don’t have an opinion on how things are installed you can choose the automatic route. I wanted to specify what directories were used during the install so I chose the manual route and used the settings above.

It will take a few minutes for everything to download. You will want to click on the “Download ESP-IDF Tools” to ensure that the compilers and other tools are downloaded (in addition to the Espressif SDK). If you need more help, check out Espressif’s installation guide.

Installing the Golioth Firmware SDK

Now that VScode and the ESP-IDF are installed, let’s take a moment to install the Golioth Firmware SDK. This provides the tools and sample code for connecting your ESP32 to Golioth.

Cloning the Golioth Firmware SDK

VScode has a handy tool for cloning git repositories. Bring up the command palette (ctrl-shift-p), type in gitcl, and press enter. A prompt will open in the same window for you to enter the following URL:

https://github.com/golioth/golioth-firmware-sdk.git

After pressing enter, a window will open where you can select a folder to store the repository. A folder called golioth-firmware-sdk will be placed in that location.

VScode will ask if you want to open the cloned repository. Please click Cancel on this window. The Golioth Firmware SDK supports multiple platforms and we will open the ESP-IDF specific directory in the next step.

Open the project and update the git submodules

Now that the repository has been cloned, let’s open the sample code in VScode. Click File→Open Folder and navigate to the golioth-firmware-sdk/examples/esp_idf/golioth_basicsfolder, then click Open.

The Golioth SDK includes a few packages as submodules and these must be updated before continuing. We’re going to use the terminal for this step. In VScode click Terminal→New Terminal. A terminal window will open in the golioth-basics folder. Type this command to update the submodules:

git submodule update --init --recursive

Type exit to close the terminal window.

Build, flash, and monitor the golioth-basics application

Now that everything is installed we get to see the ease of using an IDE.

ESP-IDF Build, Flash and Monitor

The bar along the bottom of the VScode window includes icons for working with the ESP-IDF tools. Make sure your ESP32 is plugged into USB. Click the flame-shaped icon which will build the project, flash it to the ESP32, and open a serial connection to the chip.

The build will take place and then VScode will open a window in the top center prompting you to select JTAG/UART/DFU. We will be using UART. Also note that there is a selection in the bottom menu bar where you can set the port that will be used when flashing (the image above shows /dev/ttyUSB1 in my case).

Assign device credentials in the monitor window

ESP32 running the golioth-basics app

The golioth-basics app will begin running immediately and you should see an output from the chip in a window inside VScode. We need to give the chip WiFi and Golioth credentials so that it can connect to the cloud.

If you have not yet signed into Golioth, our Dev Tier is free for your first 50 devices. (Tip: there is a Console Overview on our docs that will walk you through creating a set of device credentials.) Get your Golioth credentials, and the login info for your WiFi access point, and pass them to the chip using this command format:

settings set wifi/ssid YourWiFiAccessPointName
settings set wifi/psk YourWiFiPassword
settings set golioth/psk-id YourGoliothDevicePSK-ID
settings set golioth/psk YourGoliothDevicePSK

assign credentials to the device

Once you’ve set the credentials, type reset and the ESP32 will reboot, connect to WiFi and then to Golioth.

Successful connection to Golioth

Wrapping up

You’ve successfully compiled, flashed, and run a demo Golioth application for ESP-IDF using VScode. The same principles can be applied to your own projects.

If you’d like to dig deeper into how the golioth-basics code works, I encourage you to study the golioth_basics.c file in the golioth-firmware-sdk/examples/common folder. It demonstrates all of the Golioth device management features like OTA firmware updates, remote procedure calls (RPC), IoT fleet settings service, LightDB State and LightDB Stream data services, and remote logging.

We’d love to hear about the projects your working on. Share your successes and post your question on the Golioth Forums. If you’re interested in learning how to add Golioth to your IoT fleet, get in touch with our Developer Relations crew.

References:


Adding Golioth’s device management features to an existing ESP-IDF project is a snap. The Golioth Firmware SDK has excellent support for Espressif parts. Simply add Golioth as a component in your build, enable it in the CMake and Kconfig files, and start using the API functions.

Today I’m going to walk through how to do this using an ESP32 development board, however, any of the ESP32 family of chips (ESP32s2, ESP32c3, etc.) will work. Advanced users will also want to review the Golioth Firmware SDK Integration Guide which is the bases for this post.

Walkthrough

Since this article is about adding Golioth to an existing ESP-IDF application, I assume you already have the ESP-IDF installed. If you do not, you may consider following our ESP-IDF quickstart guide before continuing.

For illustration purposes, I’ve copied Espressif’s /esp-idf/examples/wifi/getting_started/station example code to a folder called esp_hello_golioth and will add the Golioth device management features to the program.

cp -r ~/esp-idf/examples/wifi/getting_started/station esp_hello_golioth

If you are following along, you will want to set your WiFi credentials either by using menuconfig or by changing the default values in main/Kconfig.projbuild.

1. Install Golioth as a component

Add the Golioth Firmware SDK as a submodule of your project. (Note that this means you need to have your project under version control. Hint: git init)

cd ~/esp_hello_golioth
git submodule add https://github.com/golioth/golioth-firmware-sdk.git third_party/golioth-firmware-sdk
git submodule update --init --recursive

2. Add the Golioth SDK to your CMake configuration

We need to tell CMake to include the Golioth SDK in the build. This is done by editing the project’s top-level CMakeLists.txt file and adding the following line before the project() directive in that file:

list(APPEND EXTRA_COMPONENT_DIRS third_party/golioth-firmware-sdk/port/esp_idf/components)

We also need to add the Golioth SDK as a dependency. This is done by editing the deps list in the CMake file in the main directory of the project. For this ESP-IDF example code, there are no existing deps so I added the following to the top of main/CMakeLists.txt:

set (deps
     "golioth_sdk"
)

3. Add Kconfig settings

Golioth needs MbedTLS so it must be enabled via the Kconfig system. I created an sdkconfig.defaults file in the top-level folder and added the following:

CONFIG_MBEDTLS_SSL_PROTO_DTLS=y
CONFIG_MBEDTLS_PSK_MODES=y
CONFIG_MBEDTLS_KEY_EXCHANGE_PSK=y
CONFIG_GOLIOTH_AUTO_LOG_TO_CLOUD=1
CONFIG_GOLIOTH_COAP_REQUEST_QUEUE_MAX_ITEMS=20

The final two symbols were added because I plan to send logging messages to the Golioth servers.

4. Use Golioth API calls in your C code

Now that we’ve unlocked Golioth we can start making API calls. Gain access to the functions by including the Golioth header file:

#include "golioth.h"

For this demo I created a counter to keep track of a forever loop. After a five-second pause, the counter value is sent to Golioth as a Log message, then sent as a LightDB State value. The highlighted code beginning at line 14 is what I added.

void app_main(void)
{
    //Initialize NVS
    esp_err_t ret = nvs_flash_init();
    if (ret == ESP_ERR_NVS_NO_FREE_PAGES || ret == ESP_ERR_NVS_NEW_VERSION_FOUND) {
      ESP_ERROR_CHECK(nvs_flash_erase());
      ret = nvs_flash_init();
    }
    ESP_ERROR_CHECK(ret);

    ESP_LOGI(TAG, "ESP_WIFI_MODE_STA");
    wifi_init_sta();

    //Everything above this line is unchanged from the ESP-IDF example code

    const char* psk_id = "your-golioth@psk-id";
    const char* psk = "your-golioth-psk";

    golioth_client_config_t config = {
            .credentials = {
                    .auth_type = GOLIOTH_TLS_AUTH_TYPE_PSK,
                    .psk = {
                            .psk_id = psk_id,
                            .psk_id_len = strlen(psk_id),
                            .psk = psk,
                            .psk_len = strlen(psk),
                    }}};
    golioth_client_t client = golioth_client_create(&config);

    uint16_t counter = 0;
    while(1) {
        GLTH_LOGI(TAG, "Hello, Golioth! #%d", counter);
        golioth_lightdb_set_int_async(client, "counter", counter, NULL, NULL);
        ++counter;
        vTaskDelay(5000 / portTICK_PERIOD_MS);
    }
}

For simplicity I hardcoded the Golioth credentials (PSK-ID/PSK) which is not a best practice as hardcoded credentials will not survive a firmware upgrade. Both shell and Bluetooth provisioning are demonstrated in the golioth_basics example code which stores these credentials in non-volatile flash.

See the results on the Golioth Console

The serial output of this app shows the Golioth client connecting and Log messages being sent.

I (937) wifi:AP's beacon interval = 102400 us, DTIM period = 2
I (1647) esp_netif_handlers: sta ip: 192.168.1.159, mask: 255.255.255.0, gw: 192.168.1.1
I (1647) wifi station: got ip:192.168.1.159
I (1647) wifi station: connected to ap SSID:TheNewPeachRepublic password:123456789101112internetplease
I (1657) golioth_mbox: Mbox created, bufsize: 2184, num_items: 20, item_size: 104
I (1667) wifi station: Hello, Golioth! #0
W (1677) wifi:<ba-add>idx:0 (ifx:0, c6:ff:d4:a8:fa:10), tid:0, ssn:1, winSize:64
I (1677) golioth_coap_client: Start CoAP session with host: coaps://coap.golioth.io
I (1697) libcoap: Setting PSK key

I (1697) golioth_coap_client: Entering CoAP I/O loop
I (1917) golioth_coap_client: Golioth CoAP client connected
I (6707) wifi station: Hello, Golioth! #1
I (11707) wifi station: Hello, Golioth! #2
I (16707) wifi station: Hello, Golioth! #3
I (21707) wifi station: Hello, Golioth! #4
I (26707) wifi station: Hello, Golioth! #5
I (31707) wifi station: Hello, Golioth! #6
I (36707) wifi station: Hello, Golioth! #7
I (41707) wifi station: Hello, Golioth! #8
I (46707) wifi station: Hello, Golioth! #9

Both Log messages and State data can be accessed from the tabs along the top of the device view in the Golioth Console. Navigate there by selecting Devices from the left sidebar menu and then choosing your device from the resulting list.

The log view shows each message as it comes in, and from the timestamps we can see that the five-second timer is working. For long-running operations, there are time-window selection tools as well as filters for log levels, devices, and modules.

The LightDB State view shows persistent data so you will always see the most recently reported value at the “counter” endpoint. Make sure the refresh dialog in the upper right is set to Auto-Refresh: Real-time to ensue you see the updates as they arrive from the device.

Give Golioth a try!

We built Golioth to make IoT design easier for firmware developers. We’d love it if you took our platform for a test-drive! With our Dev Tier, your first 50 devices are always free. Grab an ESP32 and you’ll have data management, command and control, and OTA firmware update in your toolbelt in no time.

Once your first device is online and talking back to the Cloud, your problems immediately start to multiply. As you go from one to ten to one hundred devices, you want to understand some basic information about all the devices in your fleet. This week we showcased how to visualize this data by creating a “Fleet View” in Grafana. Let’s look an how you can build one of your own.

Moving from a Device View to a Fleet View

The example in the video uses the devices in a project related to the Golioth IoT Trashcan Reference Design. In that setup, we have a single device view so that we can visualize the depth of data coming off of the device:

Fig 1. “Device View” Dashboard

In the fleet view we take that individual device data and stretch it horizontally across the page for each individual device. From there, replicate each of the chosen boxes to get the same view for every device in a fleet, in this case it’s 6 devices. The resulting dashboard looks like this:

Fig 2. “Fleet View” Dashboard

The ability to replicate the setup across all the device in a fleet is built upon two elements of Grafana: creating a variable and using the ‘repeat’ option for each visualization element.

Creating a variable

We have posted about creating Grafana dashboards in the past. The first thing you need to do is set up a “data source” to configure Grafana to talk to the Golioth REST API. This is how you will extract the data that your devices are sending back to the Golioth Cloud. Each device has a unique ID that Golioth uses to coordinate data moving through the Golioth platform.

When we want to visualize more than one device in our system, we need to make it possible for Grafana to dynamically switch between the different Golioth Unique Identifiers for all the devices on your project. The first step is to create a variable in Grafana that represents all of the devices.

Click on the gear icon to access the “Dashboard Settings Menu” on the upper right of your dashboard (hit ‘esc’ if you don’t see anything on the upper right of your dashboard, your menu may be hidden).

This will take you to the following screen, click on Point A to get into the variables menu and then click ‘+New Variable’ or click on the variable you want to modify at Point B.

Fig 3. Dashboard Settings Menu

In the variable creation/editing menu, you can set a name (Point 2 in the image below). You will need to select your JSON API data source that connects you to the Golioth REST API (Point 3).

Under the ‘Path’ menu, you will need to do a GET request at the /devices/ end point (not shown). Then replicate the variables shown (Point 4) to pull back data from your project that includes an array of all device IDs in a project ($..id / value) and the associated names of all devices in your project ($..name / text).

Finally you will want to toggle Multi-Select and Include All Option (Point 5). This will give your dashboard a pulldown menu, as is showcased in the video above.


Fig 4. Variable creation menu

Finally, you need to set these newly created fields in the Experimental tab (Point 6) and set the “Variable text” and “Variable value” (Point 7).

Fig. 5 Variable Experimental Tab

You now have a variable you can work with in your project.

Creating a repeating element on your Fleet Dashboard

Each individual box shown in Fig. 2 is a Grafana “panel”, which means you can connect it to a data source and do some kind of visualization with it. Normally this is a chart, a dial, a displayed value, or an icon/graphic you assign to a state.

When you edit one of these panels, you need to change two things to enable “fleet view”. The first is to change the target on the Path tab (Point C) to point to the /devices/${device}/stream endpoint on the REST API. This will automatically change which set of device data we’re looking at when we change the pulldown in the upper left corner. As shown, it is looking up the Golioth Device ID for “Trashcan A5” and inserting that into the path in place of ${device}. See below for the code I have in the “Body” field that you can use as a model when doing a POST request to the REST API.

Next we want to modify the “Repeat options” on the right sidebar (Point D). I selected that we repeat based on all of the devices we have selected. I also selected that the “Repeat direction” is vertical so it stacks up the repeated panels on top of one another to get a view like in Fig. 2. See this in action with the associated YouTube video.

Fig. 6 Edit Panel View

{
    "start" : "${__from:date}",
    "end" : "${__to:date}",
	"perPage" : 999,
	"query": {
		"fields" : [
			{ "path": "time" },
			{ "path": "deviceId"},
			{ "path": "*"}
		],
		"timeBucket" : "5s"
	}
}

Build your next fleet with Golioth

In addition to the flexibility that a Grafana dashboard can provide, the Golioth Console acts as a more text-focused fleet visualization and control plane for your devices out in the field. We think you can understand a good amount about your devices simply from glancing at your project Console and seeing the state of each device.

We always want to hear about how we can improve the experience for our users. Please try out the Console with our free Dev tier and then stop by our Forum to discuss your fleet deployment!

The most sought-after Golioth feature is OTA, also known as Over-the-Air firmware updates. When you put an IoT device into the field it’s crucial that you be able to push firmware updates to it without human intervention. Golioth makes simplifies the process for your ESP-IDF projects.

Today we’re walking through the OTA process:

  • Build and flash the initial firmware to the device
  • Provision the device with credentials that will be persistent across firmware updates
  • Build a new revision of the firmware
  • Upload the firmware to Golioth and roll it out as a release
  • Observe the device detecting, downloading, and running the new firmware

Prerequisites:

Please ensure that you have installed a copy of the the ESP-IDF v4.4.2 to your computer. Today’s article will use an ESP32 but this will work with other variants like the ESP32s2, ESP32c3, etc.

Clone a copy of the Golioth Firmware SDK (which includes ESP-IDF support). To do, please follow the “Cloning this repo section” in the README.

Commands in this guide are based on a Linux operating system with the ESP-IDF and Golioth Firmware SDK installed in the home directory (~/). However, these are cross-platform tools and are easy to adapt to your system and your preferred install directories.

Build and flash the initial firmware

In a classic Chicken-or-Egg scenario, to perform a Golioth OTA update your device needs to be running firmware built for Golioth OTA. We can use the golioth_basics example which is ready to run without changes.

First, let’s make sure our ESP-IDF is set to the correct version and enabled for this session:

cd ~/esp-idf
git fetch
git checkout v4.4.2
git submodule update --init --recursive ./install.sh all
source export.sh

Now move to the ESP-IDF section of the Golioth Firmware SDK, specifically the golioth_basics example. We’ll build, flash, and run this code on the ESP32:

cd ~/golioth-firmware-sdk/examples/esp_idf/golioth_basics
idf.py build
idf.py flash
idf.py monitor

On some systems you will need to hold the boot button on the ESP32 in order to flash the code. I find to get the monitor command to work I need to first hold the boot button, then press reset when the screen says “waiting for download”. One last tip: CTRL-] is used to exit from the idf.py monitor screen.

Assign device credentials and connect

There are a number of ways to assign credentials to your device (including Bluetooth via your browser!) but perhaps the easiest is to type them into the shell. Head over to the Golioth Console and select your device’s credentials tab. (If you don’t have an account, sign up for the Dev Tier now, your first 50 devices are free.)

Use your the shell window to set the credentials. Here you can see the process, with the four commands for Golioth and WiFi credentials highlighted:

Type 'help' to get the list of commands.
Use UP/DOWN arrows to navigate through command history.
Press TAB when typing command name to auto-complete.
esp32> W (2212) golioth_example: WiFi and golioth credentials are not set
W (2212) golioth_example: Use the shell settings commands to set them, then restart
esp32> 
esp32> settings set golioth/psk-id 20221122201152-esp32@developer-training
Setting golioth/psk-id saved
esp32> settings set golioth/psk 5bfb64ad29dce4e3dd30ab10c5b95a6a
Setting golioth/psk saved
esp32> settings set wifi/ssid MyWifiAp
Setting wifi/ssid saved
esp32> settings set wifi/psk MyWifiPassword
Setting wifi/psk saved
esp32> reset

The final command resets the device so that it will use the new credentials. You should see this output:

I (4235) esp_netif_handlers: sta ip: 192.168.1.159, mask: 255.255.255.0, gw: 192.168.1.1
I (4235) example_wifi: WiFi Connected. Got IP:192.168.1.159
I (4235) example_wifi: Connected to AP SSID: MyWifiAp
I (4255) golioth_mbox: Mbox created, bufsize: 2184, num_items: 20, item_size: 104
I (4255) golioth_basics: Waiting for connection to Golioth...
W (4295) wifi:<ba-add>idx:0 (ifx:0, c6:ff:d4:a8:fa:10), tid:0, ssn:1, winSize:64
I (4395) golioth_coap_client: Start CoAP session with host: coaps://coap.golioth.io
I (4405) libcoap: Setting PSK key

I (4415) golioth_coap_client: Entering CoAP I/O loop
I (4805) golioth_basics: Golioth client connected
I (4805) golioth_basics: Hello, Golioth!
I (4815) golioth_coap_client: Golioth CoAP client connected
I (4815) golioth_fw_update: Current firmware version: 1.2.5
I (5735) golioth_fw_update: Waiting to receive OTA manifest
I (5835) golioth_basics: Synchronously got my_int = 42
I (5845) golioth_basics: Entering endless loop
I (5845) golioth_basics: Sending hello! 0
I (5935) golioth_fw_update: Received OTA manifest
I (5935) golioth_fw_update: Manifest does not contain different firmware version. Nothing to do.
I (5945) golioth_fw_update: Waiting to receive OTA manifest
I (6545) golioth_basics: Callback got my_int = 42
W (9805) golioth_coap_client: CoAP message retransmitted
W (10335) golioth_coap_client: 4.00 (req type: 3, path: .c/status), len 59
I (15845) golioth_basics: Sending hello! 1
I (21965) wifi:bcn_timout,ap_probe_send_start
I (25855) golioth_basics: Sending hello! 2
I (35005) wifi:bcn_timout,ap_probe_send_start
I (35855) golioth_basics: Sending hello! 3

First the ESP32 connects to WiFi, then Golioth. After checking (and not finding) a firmware update available, this example begins sending hello messages every few seconds.

Now let’s do an OTA firmware update

We connected to Golioth with the device, now let’s build and upload a new firmware package to test the OTA capabilities. We’ll use the same code, updating the Current Version number which the device uses to identify when an update is needed. We’ll also change the string used in the log messages so it’s easy to recognize that our new firmware is running.

Change the source code version and rebuild

The file we need to update is a common file used by multiple Golioth SDKs. Edit the ~/golioth-firmware-sdk/examples/common/golioth_basics.c file:

#define TAG "golioth_basics_new"

// Current firmware version
static const char* _current_version = "1.2.6";

You can see I’ve appended “_new” to the tag name and incremented the version number to 1.2.6. Now we’re ready to rebuild… but remember, don’t flash this to your ESP32. We’re going to upload it to Golioth and perform a remote firmware update!

cd ~/golioth-firmware-sdk/examples/esp_idf/golioth_basics
idf.py build

The newly built binary is located in the build folder.

Upload firmware to Golioth and roll out a release

After much preamble we’ve arrived at the important moment.

To set the scene, the ESP32 that’s running on your desk is a remote IoT device taking sensor readings in a brick-and-mortar retail establishment in Waldorf, Maryland. We’ll push an update to it using a three-step process:

  1. Upload the binary as an “artifact”
  2. Create a “release” using the artifact
  3. Click the “rollout” button to make the release live

Go to the Golioth Console and select Firmware Update→Artifacts from the left sidebar. Click the “Create” button.

Golioth OTA create artifact

The only thing we’re going to change on this window is the “Artifact Version”. Type in the same version number you entered in the sourcecode for this firmware (probably 1.2.6 if you’re following along). Click the upload icon in the middle of the window and choose the “golioth_basics.bin” file from the build directory where you ran the idf.py build command. Finally, click the Upload Artifact button.

You have the option here to use a Blueprint. I’m not detailing that today for brevity, but it’s a good practice to use Blueprints to organize your production devices.

Now let’s create a release based on the artifact. Click Firmware Update→Release from the left sidebar and click the Create button.

Golioth OTA Release

All we’re going to do here is to chose the artifact we previously created in the Artifacts box and press Create Release.

You have some options here, most notably you can choose to start the rollout as soon as the release is created. I prefer to wait and roll it out as a separate confirmation step in case I made some mistake along the way.

Note that you have the option here of selecting device Blueprints and Tags to make this a more targeted release. This window is telling me the release will apply to 51 devices (!). That’s okay here because these are all test devices on a test project that we use for training.

Finally, let’s roll out the release to our devices:

Golioth OTA rollout

The Rollout button is all that stand between you and automatic updates. Click it and you will (almost) immediately see your device begin to download the new binary.

Here’s an awesome feature to keep in mind. When you have more than one release, you can use this button to rollback to previous versions. This means if you realize you released an update that has a bug, you can just toggle this button and all of your devices will automatically download the next-newest release that has rollout selected.

Watch your ESP32 update

If you read the source code for the golioth_basics example you will notice that it calls golioth_fw_update_init(client, _current_version);. That means the device has registered with the Golioth servers to receive updates when new firmware is available. Look in the terminal output and you will see the result:

I (175827) golioth_basics: Sending hello! 17
I (185007) golioth_fw_update: Received OTA manifest
I (185007) golioth_fw_update: Current version = 1.2.5, Target version = 1.2.6
I (185017) golioth_fw_update: State = Downloading
I (185317) golioth_fw_update: Image size = 1211744
I (185327) golioth_fw_update: Getting block index 0 (1/1184)
I (185827) golioth_basics: Sending hello! 18
W (187867) golioth_coap_client: CoAP message retransmitted
I (187947) fw_update_esp_idf: Writing to partition subtype 17 at offset 0x1a0000
I (187947) fw_update_esp_idf: Erasing flash
I (191627) golioth_fw_update: Getting block index 1 (2/1184)
I (191837) golioth_fw_update: Getting block index 2 (3/1184)
I (192037) golioth_fw_update: Getting block index 3 (4/1184)
I (192187) golioth_fw_update: Getting block index 4 (5/1184)
I (192447) golioth_fw_update: Getting block index 5 (6/1184)
I (192597) golioth_fw_update: Getting block index 6 (7/1184)

... snip ...

I (279837) golioth_fw_update: Getting block index 1181 (1182/1184) 
I (280107) golioth_fw_update: Getting block index 1182 (1183/1184) 
I (280317) golioth_fw_update: Getting block index 1183 (1184/1184) 
I (280457) golioth_fw_update: Total bytes written: 1211760 
I (280467) esp_image: segment 0: paddr=001a0020 vaddr=3f400020 size=29df0h (171504) map 
I (280527) esp_image: segment 1: paddr=001c9e18 vaddr=3ffbdb60 size=05868h ( 22632) 
I (280537) esp_image: segment 2: paddr=001cf688 vaddr=40080000 size=00990h ( 2448) 
I (280547) esp_image: segment 3: paddr=001d0020 vaddr=400d0020 size=d9a64h (891492) map 
I (280847) esp_image: segment 4: paddr=002a9a8c vaddr=40080990 size=1e2a0h (123552) 
I (280887) esp_image: segment 5: paddr=002c7d34 vaddr=50000000 size=00010h ( 16) 
I (280887) golioth_fw_update: State = Downloaded 
I (281127) golioth_fw_update: State = Updating 
I (281327) fw_update_esp_idf: Setting boot partition 
I (281337) esp_image: segment 0: paddr=001a0020 vaddr=3f400020 size=29df0h (171504) map 
I (281397) esp_image: segment 1: paddr=001c9e18 vaddr=3ffbdb60 size=05868h ( 22632) 
I (281417) esp_image: segment 2: paddr=001cf688 vaddr=40080000 size=00990h ( 2448) 
I (281417) esp_image: segment 3: paddr=001d0020 vaddr=400d0020 size=d9a64h (891492) map 
I (281717) esp_image: segment 4: paddr=002a9a8c vaddr=40080990 size=1e2a0h (123552) 
I (281757) esp_image: segment 5: paddr=002c7d34 vaddr=50000000 size=00010h ( 16) 
I (281827) golioth_fw_update: Rebooting into new image in 5 seconds 
I (282827) golioth_fw_update: Rebooting into new image in 4 seconds 
I (283827) golioth_fw_update: Rebooting into new image in 3 seconds 
I (284827) golioth_fw_update: Rebooting into new image in 2 seconds 
I (285827) golioth_fw_update: Rebooting into new image in 1 seconds

... snip ...

I (4267) esp_netif_handlers: sta ip: 192.168.1.159, mask: 255.255.255.0, gw: 192.168.1.1
I (4267) example_wifi: WiFi Connected. Got IP:192.168.1.159
I (4277) example_wifi: Connected to AP SSID: TheNewPeachRepublic
I (4287) golioth_mbox: Mbox created, bufsize: 2184, num_items: 20, item_size: 104
I (4287) golioth_basics_new: Waiting for connection to Golioth...
W (4297) wifi:<ba-add>idx:0 (ifx:0, c6:ff:d4:a8:fa:10), tid:0, ssn:1, winSize:64
I (4307) golioth_coap_client: Start CoAP session with host: coaps://coap.golioth.io
I (4307) libcoap: Setting PSK key

I (4317) golioth_coap_client: Entering CoAP I/O loop
I (4637) golioth_basics_new: Golioth client connected
I (4647) golioth_coap_client: Golioth CoAP client connected
I (4657) golioth_basics_new: Hello, Golioth!
I (4657) golioth_fw_update: Current firmware version: 1.2.6
I (4657) golioth_fw_update: Waiting for golioth client to connect before cancelling rollback
I (4677) golioth_fw_update: Firmware updated successfully!
I (4727) golioth_fw_update: State = Idle
I (5937) golioth_basics_new: Synchronously got my_int = 42
I (5937) golioth_basics_new: Entering endless loop
I (5937) golioth_basics_new: Sending hello! 0

First, the device compares version numbers and then begins to download blocks of the new firmware. Once downloaded it will reboot, connect to Golioth, and verify that it is running the newest version. The log labels near the end of the output now show golioth_basics_new, confirming one of the changes we made to our source code.

Golioth OTA report firmware version

On the Golioth Console, the summary view for this device confirms the currently running firmware version is 1.2.6!

With Golioth, OTA is built into the SDK

Golioth has done the heavy lifting so that you don’t need to. Our SDK uses just the single API call to register your devices for firmware updates. Use the fleet management tools on the Golioth Cloud to provision your devices in groups and by hardware variants. These make it possible to target your test devices for the first round of updates, or push new features just to the devices on the fourth floor of your Des Moines plant.

These robust tools are crucial for successful, long-lasting IoT deployments, and and they’re ready for you to start using right now. If you have any questions, we’d love to talk! Reach out to us on the Golioth Forum or get in touch with the DevRel team for demo.

If there’s a driver built into Zephyr, controlling a part over Serial Peripheral Interface (SPI) is a snap. But there’s an ocean of parts out there and only so many built-in drivers in existence. Today I’m going to show you how to use generic SPI devices with Zephyr so you can try writing your own test code in userspace, to be used for the long term or in preparation for creating a driver.

New to Golioth? Sign up for our newsletter to keep learning more about IoT development or create your free Golioth account to start building now.

SPI is simple, right?

In practice, communicating with SPI devices is simple…but only after you get the hardware peripheral configured for your chip. Zephyr is built for cross-compatibility, but that is sometimes its biggest usability flaw. The SPI bus and the devices themselves are abstracted so much that it’s hard to know where to begin if you need to do it all yourself.

I spent far too long searching the internet for a guide before I remembered that all Zephyr systems have tests. Don’t be me, check the test files before you head to Google.

It turns out that the Zephyr SPI driver tests tell us how to register a generic SPI device, and then how to talk to it.

Zephyr SPI Step-by-Step

For this experiment I have chosen perhaps the easiest SPI chip ever, the Microchip MCP3201 12-bit ADC. No need to send register settings to that device, you simply enable the chip-select pin and toggle the clock signal to start shifting out ADC readings. In short: all I need is to read 4-bytes. That’s it!

1. Enable SPI in KConfig

First things first, we need to tell Zephyr to build SPI support into the app. We also need the ability to control GPIO pins. Add these to your prf.conf file:

CONFIG_GPIO=y
CONFIG_SPI=y

Why enable a library unless you’re actually going to use it? Let’s add these line to main.c to ensure we can access all of the Zephyr SPI goodness:

#include <drivers/gpio.h>                                                                                                                                                     
#include <drivers/spi.h>

2. Add a SPI node in the overlay file

Next, we need to tell Zephyr where to find our SPI device. The idiomatic way of doing this is to use the DeviceTree. For this project I’m using a Sparkfun Thing Plus nrf9160 so I needed to remap some pins for this device.

&spi2 {
        status = "okay";
        cs-gpios = <&gpio0 18 GPIO_ACTIVE_LOW>;
        pinctrl-0 = <&spi2_default>;
        pinctrl-1 = <&spi2_sleep>;
        pinctrl-names = "default", "sleep";
        mcp3201: mcp3201@0 {
                compatible = "vnd,spi-device";
                reg = <0>;
                spi-max-frequency = <1600000>;
                label = "mcp3201";
        };
};

&pinctrl {
        spi2_default: spi2_default {
                group1 {
                        psels = <NRF_PSEL(SPIM_SCK, 0, 19)>,
                                <NRF_PSEL(SPIM_MOSI, 0, 21)>,
                                <NRF_PSEL(SPIM_MISO, 0, 22)>;
                };
        };

        spi2_sleep: spi2_sleep {
                group1 {
                        psels = <NRF_PSEL(SPIM_SCK, 0, 19)>,
                                <NRF_PSEL(SPIM_MOSI, 0, 21)>,
                                <NRF_PSEL(SPIM_MISO, 0, 22)>;
                        low-power-enable;
                };
        };
};

Don’t be scared away, I had to include all of this in order to remap which pins were being used for SPI on this device. Your mileage will vary based on your chip, just make sure you choose the correct SPI node (spi2, in my case) and include the highlighted lines above as the added node.

Note that SPI requires a chip-select (CS) pin. Zephyr will handle this for you automatically. Study the example above. You will see one entry called cs-gpios. This is a comma-separated list inside of arrow-brackets. If you have multiple SPI devices, just add each CS pin inside those brackets. It’s a zero-indexed list, and the CS for the mcp3201 is the zeroth entry in that list.  I use an @0 in the path and reg = <0> to tell Zephyr which CS pin to use.

I’ve identified this device as compatible with vnd,spi-device. Technically I should be defining my own DeviceTree binding instead of leaning on this “vendor” definition that is meant for testing purposes only. To learn the recommended way, here’s a 2-hour Zephyr driver talk from ZDS 2022. Let’s not get bogged down in the voodoo of DeviceTree; shall we move along and leave the bindings creation process for a future post?

3. Set up the memory structure

The memory structure is a bit quirky for SPI reads. Generally speaking, you need to set up the memory structure to perfectly mirror how much data you want to read or write. I’m only going to be reading in this example.

I want to read four bytes so I need a four-byte array. That array needs to be a member of a spi_buf, and that spi_buf needs to be a member of a spi_buf_set:

uint8_t my_buffer[4] = {0};
struct spi_buf my_spi_buffer[1];
my_spi_buffer[0].buf = my_buffer;
my_spi_buffer[0].len = 4;
const struct spi_buf_set rx_buff = { my_spi_buffer, 1 };

Honestly this was very confusing for me to figure out. It might be this way for DMA-based SPI peripherals. Or maybe this schema enables you to kind of pre-parse data of different lengths. I haven’t found documentation on why this this structure is the way it is. If you have any insight, please let us know on the Golioth forum thread for this post.

Basically the SPI peripheral is going to shift bits until it runs out of room in your memory structure. So format this for exactly the length of data you need to read/write and Zephyr takes care of the rest.

4. Get the device from the DeviceTree

It’s time to get the SPI device from the DeviceTree. This is a great time to include the configuration for your SPI bus. I followed the Zephyr test file examples and first defined my config values:

#define SPI_OP  SPI_OP_MODE_MASTER |SPI_MODE_CPOL | SPI_MODE_CPHA | SPI_WORD_SET(8) | SPI_LINES_SINGLE

Once we get to the main function, it’s now a much simpler call to get your SPI device:

const struct spi_dt_spec mcp3201_dev =
                SPI_DT_SPEC_GET(DT_NODELABEL(mcp3201), SPI_OP, 0);

5. Issue read command

My standard advice for Zephyr applies here: always check the return codes. When working through this issue, the return codes and enabling debug-level logs in the SPI libraries helped me work out a problem with my memory structure.

ret = spi_read_dt(&mcp3201_dev, &rx_buff);
if (ret) { LOG_INF("spi_read status: %d", ret); }

What we have here is a SPI read operation which immediately prints out the return code if there were any errors. If not, the data you wanted to get from your device is now ready and waiting inside of the buffer that was passed in during the read command.

Further reading

It was quite a task for me to figure all of this out. It would have been much easier had I first looked to the test files (as I mentioned previously). You may want to write to a SPI device, or read and write at the same time. This same process can be used! You just need to also have a memory structure for the data you want to transmit, and you need to use the write, or the “transceive” versions of the SPI functions.

I suggest you start by reading through the SPI API reference. You should also make time to work through all of the functions in the spi_loopback test app which uses SPI in just about every way possible on Zephyr.

Beyond that, if you do have any questions, hit up the Zephyr discord or start a thread on the Golioth forums.

Node-RED is a graphical programming tool that makes it easy to interact with web-based events. It’s called a “Low-code” solution because you can do a lot without writing much code. I love it because it’s the right balance of handling the hard stuff for me. Initial ease of use, while still making it possible to drop in custom code when I need it. I’ve been using that to control my IoT devices on the Golioth Cloud, and today I’m sharing how I do it.

Note: the concept of a node will be highlighted with bold text throughout this article to help clarify we’re discussing one of the blobs shown on screen in Node-RED

Why use Node-RED with Golioth

Earlier this year Ben Mawbey showed us how he uses Node-RED to manipulate data as it arrives on the Golioth cloud. This approach listens for realtime data using WebSockets. But this has a couple of limitations:

  • We will only see the data when it changes
  • We aren’t able to send or update data using WebSockets.

On that second point, the Golioth REST API lets us send/update data and query stored data.

Node-RED is a good choice here, since it’s relatively easy to set up a connection to WebSockets and the REST API. It’s powerful enough to do any data manipulation we want. It does need to run on a server, but on the upside that means it is always running and can be accessible to multiple end users via any web browser, no need to install an app. Let’s dive in!

Prerequisites

This example assumes you have already taken care of the following:

  • a Node-RED server
    • The Get Started page offers several solutions like running it locally on a Raspberry Pi, or on a cloud server
  • Golioth account, and a device added on the Golioth Console
    • As always, our getting started guide will walk you through all of these details
    • You can follow the demo below without having a hardware device, we just need to create a device on the Golioth Console to send data back and forth to the cloud

Connect Node-RED to WebSockets

The secret sauce in connecting a WebSocket is the URL which includes the Golioth API key. Go to the Golioth Console and choose API Keys from the left sidebar to create a new key:

The exact formatting of the WebSockets URL is detailed on our reference page, but I’ll show you how to do it here. Notice the three pieces of important data in the diagram below: project id, device id, and finally the API key.

I have chosen to connect to the dataendpoint to monitor LightDB state data. (If you want to monitor LightDB stream you can change data to stream.)

wss://api.golioth.io/v1/ws/projects/node-red-demo/devices/62695497404e12cd12628117/data?x-api-key=ynhJQQjLautKYLxQESuqB8VJLWMEVpH7

Setting up the Node-RED flow begins by adding a WebSocket-in node and connecting it to a debug node. I have also connected a JSON node for convenient data access later.

The WebSocket-in node is configured as follows:

The WebSocket type is “Connect to” which allows us to add a new URL. Click the pencil icon or the right side of that field and in the new window paste the URL. Because we are passing the API key as part of the URL, we do not need to add a TLS configuration.

Data will only appear on this WebSocket-in node when it first arrives on the Golioth Cloud. So generate an update by going to the Golioth Console and adding the key/value pairs shown above. In the Node-RED shown in the flow setup step, notice the debug output includes the raw payload as well as the JSON object.

Connect Node-RED to REST API

Setting up the REST API connection requires a bit of code, but uses the same project, device, and API key info from the last step. Two inject nodes (that send a 1 or a 0), a function node, an https request node, and a debug node complete this flow:

The inject node and http request node need a quick settings adjustment:

Set the payload of the inject node to pass 0 or 1 as a number (not a string). In the http request node, change the method to “set by msg.method”. The magic will all happen in the function node:

Code for this function is listed below. The variables at the top are used to set up the API URL, so you will need to enter your project id, device id, API key, and the LightDB state key that makes up the endpoint (led0 in my example).

var proj_id = "node-red-demo"
var dev_id = "62695497404e12cd12628117";
var api_key = "ynhJQQjLautKYLxQESuqB8VJLWMEVpH7";
var endpoint_name = "led0";

var dev_url = "https://api.golioth.io/v1/projects/" + proj_id + "/devices/";
var endpoint = "/data/" + endpoint_name;

var data = msg.payload;

var msg = {
	"method" : "PUT",
	"url" : dev_url + dev_id + endpoint,
	"headers" : {
		"Content-Type": "application/json",
		"x-api-key": api_key
	},
	"payload" : JSON.stringify(data)
};

return msg;

This code intercepts the incoming data (which will be a 0 or 1 from the inject node), formats it as a PUT command, and sends it to the http request node which will submit it to Golioth. In this demo, clicking one of the inject nodes updates the led0 value in LightDB state.

Head over to the Golioth Console and look at the LightDB state data for your device to see the changes. In practice, you can implement the desired state versus actual state principles discussed in my recent article and use this flow to update an LED on an actual piece of hardware.

Further Exercises: Dashboard/Web App

I’ve covered a lot of ground in this article and unfortunately have run out of column inches. But before signing off, I want to mention the potential for turning Node-RED flows into web apps.

The Node-RED dashboard node adds a UI which can be loaded on any browser. It looks spectacular with almost no work from us. Here you can see I’ve set up a display that shows the state of the LED, displays the latest value of the counter, and adds two buttons to turn the LED on or off.

If you want to test this out, here is an export of this flow that you can import into your Node-RED.

A word of caution: your flow contains an API key for accessing device information on Golioth. This must be kept secure. Please make time to review how to secure Node-RED and ensure that you authenticate users if you decide to build and share a web interface.